| |
Home
We have almost certainly passed the point where greenhouse gas emission
reductions alone can prevent very serious consequences from a changing climate
(see Figure 1 below and the “About Scenarios” menu option), as the temperature
increase will likely be over 2.0°C in 2050 for any realistic emissions pathway. The only way to avoid the very
serious consequences appears to by proactively reducing the amount of sunlight
reaching the Earth’s surface until such time as sufficient CO2 can be removed
from the atmosphere to reduce the temperature increase to 1.5°C or less without the need for albedo modification.
The “Scenario Explorer” has been designed to help people to understand the
assumptions that underlie the temperature increase projections made by climate
scientists so that they can make informed decisions about the climate policies
that need to be implemented in order to avoid the most serious consequences of
global warming.
Its focuses is primarily on giving users the ability to estimate
the annual amount of sunlight that must be reflected by the atmosphere or the CO2 that must be removed from
the atmosphere in order to reach a specific temperature goal. The “SRM & CDR Explorer” allows a
specific temperature increase goal to specified (initially set to 1.5°C) and calculates the
amount of both solar radiation management and carbon dioxide removal to meet
that goal, while the “Scenario Explorer” allows for the changing of many of the
assumptions that are used to calculate the corresponding temperature increase.
This Website makes extensive use of “tooltips”, which are available whenever there is a “dotted underline” under the text.
There are nine menu options:
|
Home
|
This page
|
|
About Scenarios
|
Defines a climate scenario, discusses the data items from a scenario which the model
uses, shows several of the data items for 18 scenarios, and has graphs showing
the temperature increase projections for 51 scenarios that had 2025 data
relatively close to expected 2025 values for CO2 emissions, CO2 PPM, and
temperature increase. Please review the charts and
graphs in this section as they demonstrate why a temperature increase of over
2.0°C is expected in “mitigation only” scenarios.
|
|
Consequences
|
This page will discuss the consequences of exceeding the 1.5°C temperature
increase target for significant period of time
|
|
Background
|
Discusses some of the rationale for the Scenario Explorer
|
|
Instructions
|
Instructions on using this Web site
|
|
SRM & CDR Explorer
|
Allows a specific temperature increase goal (initially set to 1.5°C) and
calculates the amount of both solar radiation management and carbon dioxide
removes to meet that goal
|
|
Scenario Explorer
|
Allows for the changing of many of the assumptions that are used to calculate
the corresponding temperature increase.
|
|
What If
|
Describes how to user the Scenario Explorer for “What If” analysis; also
describes how the model works
|
|
About
|
About the Website
|
Click here for a description as to how the model works.
Even if net CO2 emissions
peak in 2035 and decline to zero in 2065 (see Figure 1), the temperature increase in 2100 will
be about 2.2°C. Reaching the 1.5°C
temperature increase target in 2100 would require CO2 capture and storage of 20
GTCO2 per year (about half of the current CO2 annual emissions) in addition to the CO2 capture and storage required for net zero (at a likely prohibative cost of $1-$2 Trillion per year).
Even so, the temperature would peak around 2.0°C in 2055. And this does
not take into account the sudden (and unexpected) increase in the Earth’s temperature in 2023 or the
likely acceleration of the decadal temperature increase. Table 1 shows
all of the caclulations used to derive the temperature increase without carbon removal and Table 2 shows
all of the caclulations used to derive the temperature increase with carbon removal.

Figure 1.

Table 1 Scenario Summary Without Carbon Removal
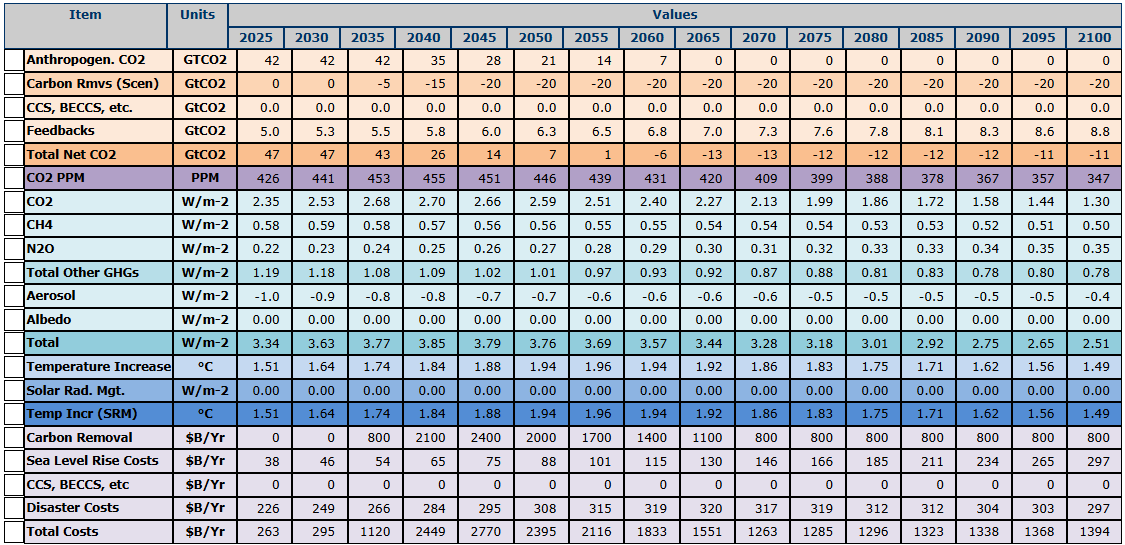
Table 2 Scenario Summary With Carbon Removal
About Scenarios
|
A climate scenario is a structured representation of possible future
climate conditions based on different assumptions about greenhouse gas
emissions, socio-economic developments, technological advancements, and policy
actions. Climate scenarios are used to model and analyze potential climate
changes and their impacts, helping policymakers, scientists, and businesses
prepare for various possible futures.
Key Aspects of Climate Scenarios:
-
Emissions Pathways – Different levels of greenhouse gas (GHG) emissions over
time, such as low-emission (net-zero), medium-emission, or high-emission
scenarios.
-
Socioeconomic Assumptions – Population growth, economic development, energy
use, and technological progress.
- Climate
Models – Projections of temperature changes, sea level rise, extreme weather
events, and other climate impacts.
- Policy
and Mitigation Strategies – Possible responses, such as carbon pricing,
renewable energy adoption, or geoengineering interventions.
Examples of Climate Scenarios:
- IPCC’s
Shared Socioeconomic Pathways (SSPs): These combine socio-economic
narratives with climate policies to explore different futures (e.g., SSP1-1.9
for aggressive mitigation, SSP5-8.5 for high fossil fuel use).
-
Representative Concentration Pathways (RCPs): Used in past IPCC reports,
showing different levels of radiative forcing by 2100 (e.g., RCP2.6 for strong
mitigation, RCP8.5 for high emissions).
-
Net-Zero Scenarios: Models from organizations like the IEA (International
Energy Agency) that project pathways to limit global warming to 1.5°C.
(The above is from ChatGPT)
|
|
This model uses the scenario data items specified in Table 1 below.
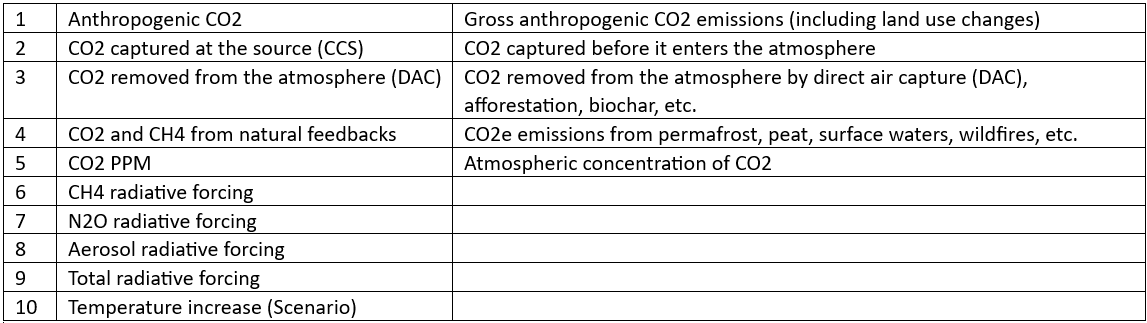
Table 1.
The model uses the above data to calculate the data items shown in Table 2.
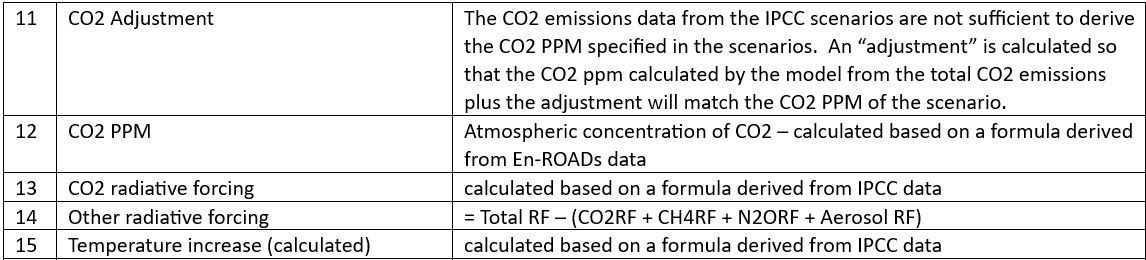
Table 2.
Most of the scenario data was obtained from either the IPCC AR6 Report
or from the En-ROADS global climate simulator. For the former, data was based on model runs from
over five years ago so their 2025 values may be off significantly. The table
below displays several datum from a number of their scenarios. The “AR6” scenarios are an average of
5-10 scenarios which had roughly the indicated temperature increase in 2100. The
“SSP” scenarios are the average of the scenarios with that name (usually two
scenarios). Note the heave reliance on CCS to meet many of the temperature
targets. Also, all of the “more plausible” scenarios project a temperature
increase close to or over 2.0 °C in 2050. (Note
that total CO2 emissions were about 41.6 GTCO2 in 2024 were about and are not
expected to change much in 2025. In 2025 the atmospheric concentration of CO2 is
expected to hit about 427 PPM and the average global temperature increase will
likely be at least 1.5°C. Keet this in mind when reviewing any of these
scenarios.)
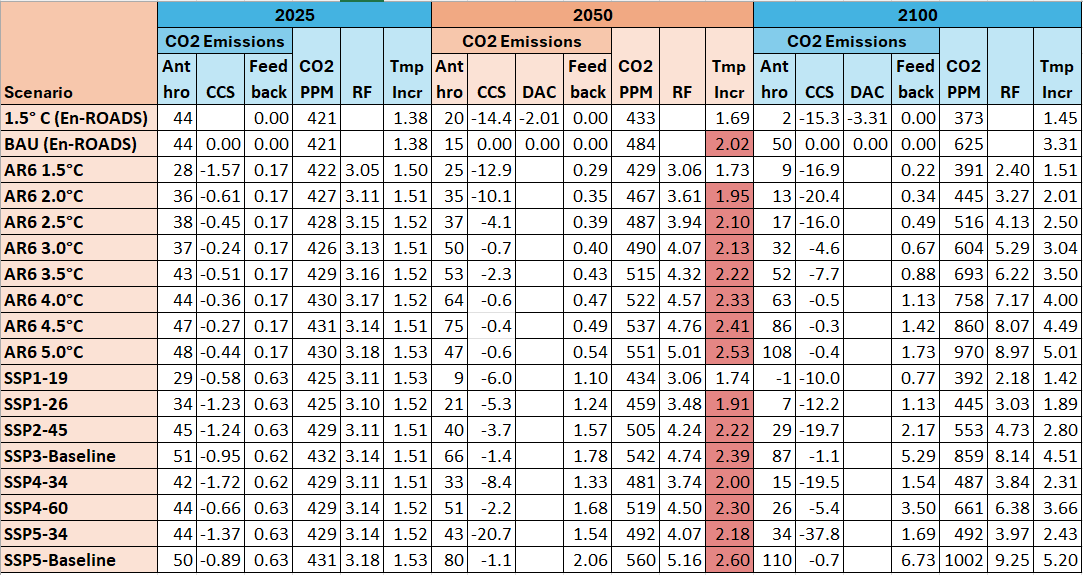
Table 3.
Of the roughly 450 scenarios in the IPCC database only 51 had 2025 data
relatively close to expected 2025 values for CO2 emissions, CO2 PPM, and
temperature increase. (Note that the average temperature change per decade is
about 0.26°C.) For most of the scenarios the temperature increase exceeded 2.0°C
in 2050. (see Figure 1).
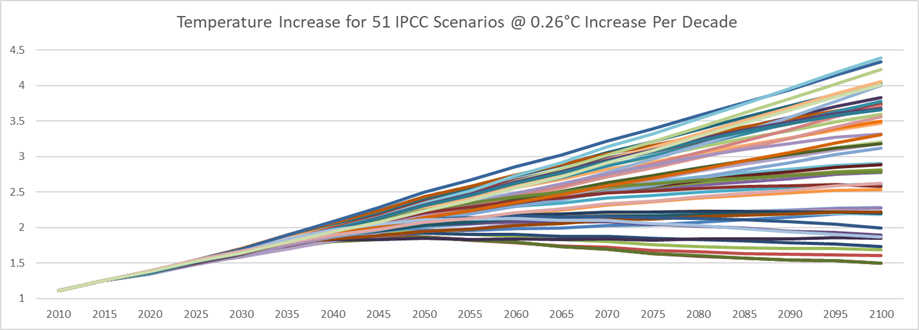
Figure 1
If Dr. James Hansen is right and there was a 0.20 W/m-2 albedo change in 2023
and the temperature increase per decade turns out to be 0.36 °C, then the
temperature increase of all of the scenarios exceeds 2.0°C in 2050 and exceeds
2.5°C in 2100
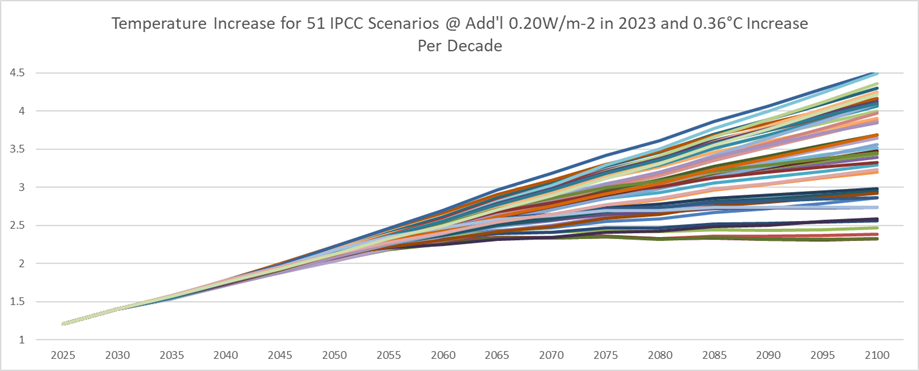
Figure 2
Figure 3 shows the expected temperature increase for scenarios where net CO2
emissions are reduced to 0 (staring in 2025) in the specified year, both with
and without an albedo change of 0.20 W/m-2 in 2025 and temperature increase of
0.36°C per decade.
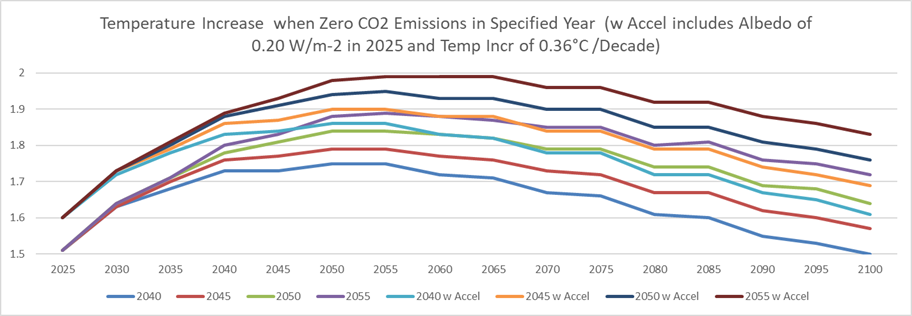
Figure 3
|
Consequences
Many climate scientists believe that there will be very serious consequences
if the global average temperature increase exceeds 1.5°C for a significant period of time, which it is almost certainly going to do. This web page will discuss the possible consequence of overshooting the 1.5°C target, which is almost certainly going to occur.
Weakening Ocean Current Patterns Reduce Global Carbon Uptake, Costing Trillions of Dollars
(Proceedings of the National Academy of Sciences, 12 January 2025)
The AMOC is a large, intertwined system of ocean currents that transports heat throughout the Atlantic Ocean, playing a key role in the
regulation of ocean temperatures and global climate patterns. By quantifying the AMOC's impact on ocean carbon uptake, this study shows that
a weaker AMOC would reduce the ocean's ability to absorb CO2, thus resulting in higher levels of atmospheric CO2 and accelerated warming globally.
This weakness could result in trillions of dollars in additional economic damage, including impacts from heatwaves, droughts, fiercer storms,
additional infrastructure reinforcement, strain on food systems, and insurance costs. The culmination of changes is predicted to raise the ‘social cost’ of
carbon by approximately 1%. Previously perceived economic "benefits" of AMOC-related cooling are thus disputed when global impacts are considered, demonstrating
that overall AMOC weakening would result in a net cost to society.
Full paper: https://www.pnas.org/doi/10.1073/pnas.2419543122
|
Climate change threatens crop diversity at low latitudes
Climate change alters the climatic suitability of croplands, likely shifting the spatial distribution and diversity of global food crop production.
Analyses of future potential food crop diversity have been limited to a small number of crops. Here we project geographical shifts in the climatic niches of
30 major food crops under 1.5–4 °C global warming and assess their impact on current crop production and potential food crop diversity across global croplands.
We found that in low-latitude regions, 10–31% of current production would shift outside the climatic niche even under 2 °C global warming, increasing to 20–48%
under 3 °C warming. Concurrently, potential food crop diversity would decline on 52% (+2 °C) and 56% (+3 °C) of global cropland.
However, potential diversity would increase in mid to high latitudes, offering opportunities for climate change adaptation.
These results highlight substantial latitudinal differences in the adaptation potential and vulnerability of the global food system under global warming.
https://www.nature.com/articles/s43016-025-01135-w
|
|
The Paris
Climate Accord if 2015 set 2°C as the level of warming that would lead to unacceptably severe consequences, affecting
ecosystems, economies, and human societies worldwide. Some of the
likely impacts include:
1. Extreme Weather and Natural Disasters
- More
frequent and intense heatwaves leading to higher mortality rates,
especially in tropical and densely populated regions.
-
Increased frequency and intensity of storms, hurricanes, and cyclones
due to warmer ocean temperatures.
- More
severe droughts in arid and semi-arid regions, reducing agricultural
yields and increasing water scarcity.
-
Worsening wildfires, particularly in Mediterranean, Californian, and
Australian climates.
2. Sea Level Rise and Coastal Impacts
- Sea levels could rise by 0.5–1 meter (or more in extreme cases), leading
to increased flooding in coastal cities like New York, Miami, Jakarta, and
Mumbai.
- More frequent and severe coastal erosion and storm surges, displacing
millions of people.
- Loss
of low-lying island nations (e.g., Maldives, Tuvalu) due to permanent
inundation.
-
Initiate loss of ice from the Antarctic
and Greenland ice sheets that would likely lead to rates of sea level rise
exceeding one or more meters per century
3. Food and Water Scarcity
-
Declining crop yields due to extreme heat, drought, and changing
rainfall patterns, especially in major grain-producing regions.
- Increased risk of global food supply shocks, causing price spikes
and exacerbating hunger and malnutrition.
-
Freshwater shortages due to glacier melt (Himalayas, Andes) and lower
river flows (Nile, Mekong, Colorado).
4. Ecosystem Collapse and Biodiversity
Loss
- Widespread coral reef die-offs (over 99% of reefs could be
lost due to ocean acidification and warming).
-
Tropical rainforest degradation, especially in the Amazon, leading to
reduced carbon sequestration.
- Mass
extinction of species, as ecosystems struggle to adapt to rapid climate
shifts.
-
Disruptions in fisheries, with fish stocks collapsing due to ocean
warming and acidification.
5. Human Health and Disease
-
Higher mortality rates due to heat-related illnesses, especially among
vulnerable populations.
- Spread of tropical diseases (malaria, dengue) into
previously temperate zones.
- Increased respiratory illnesses from worsening air
pollution and wildfire smoke.
- Rising mental health issues due to climate-induced
displacement and economic instability.
6. Economic and Social Instability
-
Climate refugees: Hundreds of millions of people may be forced to
migrate due to rising seas, drought, and failed agriculture.
- Increased conflicts over resources, especially in
water-stressed regions (Middle East, Sub-Saharan Africa).
- Rising insurance and infrastructure costs, making some
areas uninsurable.
-
Potential economic recessions or collapses in countries heavily reliant
on climate-sensitive industries (agriculture, tourism).
7. Potential Tipping Points
-
Amazon rainforest collapse, shifting from a carbon sink to a carbon
source.
-
Thawing permafrost, releasing massive amounts of methane, which could
trigger further warming.
-
Disruption of ocean currents (like the Atlantic Meridional Overturning
Circulation, AMOC), causing extreme weather shifts in Europe and North America.
- Ultimate loss of much of the Greenland and West Antarctic Ice Sheets, leading to sea level rise of order 10 meters of sea level rise over several centuries.
Conclusion
A 2°C+ warming scenario is widely
considered catastrophic, with
exponential risks beyond human control. It would
increase the urgency for
large-scale carbon dioxide removal (CDR), adaptation, and potentially risky
geoengineering measures like Solar Radiation Management (SRM).
(from ChatGPT.with
a few additions)
|
Background
|
The Scenario Explorer has been designed to allow people to both (1) review and develop
greenhouse gas emissions scenarios and (2) see the requirements to meet a temperature
increase target for both carbon dioxide removal and solar radiation management techniques.
In the "SRM & CDR Explorer" mode multiple scenarios can be both compared and contrasted graphically
(see Figure 1) while the "Review" mode displays both all of the temperature (and
some cost) calculations involved in single scenario (see Figure 2) and also some
graphs relating the scenario to sets of other scenarios (see Figure 3.). Many of
the values used in making the calculations can be changed in the "Input" mode (see
Figure 4) and additional values can be changed in the "Deep Dive " mode (see Figure
5).
|
|
|
|
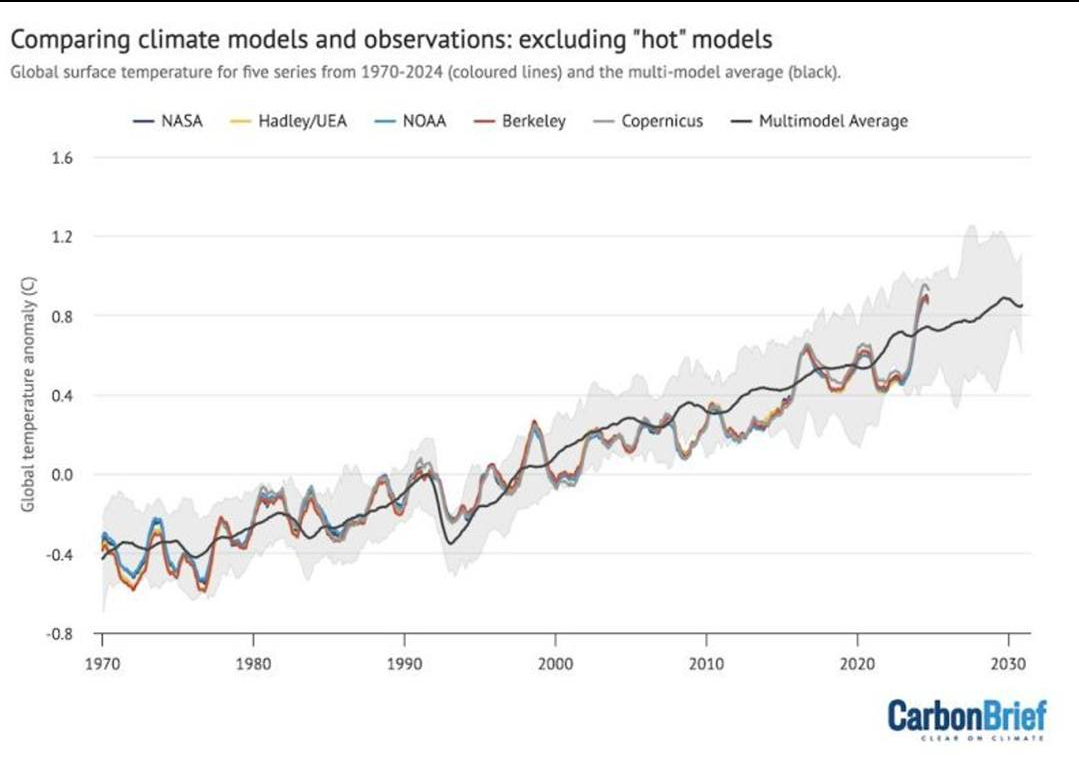
One of the main reasons for developing this model is that, while global circulation models have done a relatively good job in predicting past temperatures changes
(see Figure 6), the climate system is
beginning to behave in unpredictable ways and these models likely underestimate the future yearly temperature increases. (See "Are general circulation models obsolete?") For example:
|
- Rate of temperature incease per decade (in the IPCC data the rate is 0.26°C but Dr James Hansen expects it to be 0.36°C)
- Permanent temperature acceleration
- Accelerated natural emissions
- Permafrost thaw rate
- Peat
- Forest fires
- Forest dieback
- Surface waters
- Soils
- Natural CH4 emissions increasing faster than expected
- Albedo changes (clouds and surface reflectivity)
- The land and ocean sinks are decreasing faster than expected
|
 | | Figure 5. Model Observations
(Click image to enlarge it) |
|
Other things to consider
- Since greenhouse gas emissions have continued to increase, the IPCC scenarios which have emission reductions before 2025 should be viewed skeptically.
- Models expected CH4 emissions to decrease as aerosol also decrease, cancelling each other out. The temperature will increase faster than expected if either aerosols decrease faster than expected as coal emissions are eliminated and/or CH4 emissions decline less rapidly than expected
Since the world's nations have failed to reduce greenhouse gas emissions over the past 30 years,
it is very unlikely that that the temperature increase can be limited to 1.5 °C by 2050 and it is possible
that the temperature increase will exceed 2.0°C by 2050. As a result mitigating GHG emissions as rapidly as fast as politically possible is not sufficent.
That leaves two options for suplementing mitigation efforts in order to limit the temperature increase -
(1) remove CO2 from the atmosphere when it becomes publically affordable or
(2) intervene in the climate system by reducing the Earth's albedo to prevent very serious harm.
In order to choose the best option a consensus needs to be reached on the following:
- For planning purposes, what would be a good GHG emissions scenario to use?
- Given the above emission pathway, what GHG emissions should be expected from feedbacks?
- The Earth's temperature increased at a rate of about 0.18°C per decade from 1970 t0 2020.
Many of the IPCC scenarios projected that the temperature would increase at a rate of about 0.26°C per decade for the next 20 years.
And Dr. James Hansen expects a 0.36°C temperature increase per decade. What is a good value to use?
- What is a reasonable estimate of carbon dioxide removal costs and the amount of CO2 that can be removed from the atmosphere in 2050?
- What is a reasonable estimate of the temperature increase in 2050 and 2100 on a "mitigation only" strategy?
- What are the expected costs of the above for sea level rise, natural disasters, mitigation, carbon dioxide removal, etc. to limit the temperature increase? Reductions to GDP?
- How much carbon dioxide removal might be implemented before CO2 emissions are reduced by 80%?
- How much carbon dioxide removal might be needed before 2050? before 2100?
- There will also be very significant cost from both sea level rise and natural disasters. Good estimates for the following for the years 2022-2100 are therefore needed:
- Expected sea level rise per degree of warming
- Expected cost per foot of sea level rise
- Expected cost of weather-related natural disasters per degree of warming
This model was created to assist in answering the above questions. The model itself is relatively simple. The following assumptions were made:
- 1. Emissions from natural feedbacks depend on the temperature increase in 2100
- 2. The amount of CO2 added the atmosphere depends primarily on net CO2 emissions (Anthropogenic + Feedbacks - CDR)
- 3. The radiative forcing from CO2 depends on the atmospheric concentration of CO2
- 4. Emissions of CH2 and N2O and the radiative forcing of both aerosols and all other 'climate forcing elements' can be estimated based on the cumulative CO2 emissions and removals through 2100
- 5. The annual temperature increase in a given year depends on the total radiative forcing (from CO2, CH4, N2O, Other GHGs, Aerosols, and Albedo) and the year
Values for emissions from natural feedbacks were obtained from IPCC AR6 documentation. Formulas for calculating values for the other assumptions were derived by analyzing data from other climate models.
|
The following three tables are very rough cut at an attempt to "compare and contrast" "mitigation only" scenarios with an "SRM" scenario.
Suggestions welcome!
|
|
Table of impacts/tipping points |
|
Amazon Tropical Rain Forest |
Now a carbon source. Used to sequester xxx. Now emits. Tipping point For
Savannah. Primarily due to deforestation with cc exacerbating 2050 and 2100. |
|
Tropical Coral Reefs |
|
|
Sea level rise |
|
|
Temperature Increase |
|
|
GDP |
|
|
Feedbacks |
|
|
Ocean acidification |
|
|
AMOC |
|
|
Food Supply |
Disruptions to the food supply could be substantial due to changing storm tracks and monsoon timing and character
|
|
Comparison of Scenarios |
|
|
|
2050 |
2100 |
|
|
|
"Mitigation only"
SSP XXXX |
"Mitigation only"
SSP YYYY |
Mitigation and SRM |
"Mitigation only"
SSP XXXX |
"Mitigation only"
SSP YYYY |
Mitigation and SRM |
|
Amazon |
Cumulative
CO2 Emissions |
XXXX GT CO2 |
|
XXXX GT CO2 |
XXXX GT CO2 |
|
XXXX GT CO2 |
|
Tropical Coral Reefs |
Percent Die off |
|
|
|
|
|
|
|
Sea level rise |
Feet |
|
|
|
|
|
|
|
Temperature Increase |
°C |
|
|
|
|
|
|
|
Cost of natural disasters |
|
|
|
|
|
|
|
|
GDP |
|
|
|
|
|
|
|
|
Feedbacks |
|
|
|
|
|
|
|
|
Ocean acidification |
|
|
|
|
|
|
|
|
AMOC |
|
|
|
|
|
|
|
|
Food Supply |
|
|
|
|
|
|
|
|
Analysis of impacts/tipping points - What happens if "mitigation only" vs climate
intervention with some mitigation? |
|
Amazon Tropical Rain Forest |
The Amazon turns to savanna sooner (but still does with intervention) |
|
Tropical Coral Reefs |
Tropical Coral reefs die sooner (but they still die with intervention)
|
|
Sea level rise |
Catastrophic sea level rise occurs sooner (but still happens with intervention) |
|
Cost of natural disasters |
With "mitigation only" higher costs of natural disasters (more famines, floods,
droughts, etc.)(and sea level rise) this century |
|
GDP |
Larger reduction in GDP with "mitigation only" |
|
Feedbacks |
More feedbacks from natural emissions with "mitigation only" (hence a larger
requirement for carbon dioxide removal to meet a temperature target) |
|
Ocean acidification |
catastrophic ocean acidification will be the same |
|
AMOC |
|
|
Food Supply |
|
Instructions
|
The Scenario Explorer allows a user to explore scenarios in two "modes"
|
|
1.
|
SRM & CDR Explorer |
Allows multiple scenarios to be selected. Displays graphs for the 'NetCO2 Emissions',
'SRM Requirement', 'CDR Requirement', and 'Scenario Temperature Increase' for the
selected scenarios.
|
|
2.
|
Scenario Explorer |
Allows for the displaying of the temperature (and some cost) calculations involved
in single scenario and also some graphs relating the scenario to sets of other scenarios.
Many of the values used in making the calculations (e.g., CO2 emissions, total feedbacks,
'aggressiveness' of three non-CO2 greenhouse gas emissions, etc.) can be changed.
|
The ‘Scenario Explorer’ allows users to both explore a variety of greenhouse gas
emissions scenarios and to adjust many of the assumptions that are used in the various
calculations. An analysis of the results of global circulation models were used
to derive formulas that can be used to (1) estimate the amount of the annual CO2
emissions that remain in the atmosphere and (2) calculate a factor that can be used
to estimate the temperature increase based on the total radiative forcing. The Explorer
uses these formulas plus formulas that are based on “standard climate change equations”
(e.g., the relationship between CO2 PPM an CO2 radiative forcing) for all of the
calculations.
|
Anthropogenic CO2 emissions are the main driving force for global warming. When
you change the value in any drop down list, the program will recalculate the temperature
change for each 5-year period.
|
Many other factors also affect the global temperature change, and this model allows
the user to specify values for most of them. These factors can be organized into
three main categories: those affecting atmospheric CO2, other greenhouse gas emissions,
and those that affect the Earth's ability to reflect the incoming sunlight (albedo).
You can input values for those factors after checking the corresponding checkbox
under the "Input" label above (CO2, RF,and SRM respectively).You can view the
calculated values for those factors by checking the corresponding checkbox under
the "Display" label above (CO2, RF,and SRM respectively). (Note that clicking
the "SRM" checkbox allows the user to specifty either an annual target
tempearature or and an annual amout of SRM.)
|
Check one of the "cost" checkboxes to enter or view the carbon dioxide removal costs.
The "CO2e" checkbox is use to display the "CO2 equivalents" for the various greenhouse
gases. The checkboxes in the "Basic" row are used to determine if the most important
factors are shown or whether more specific factors are shown (e.g., "Carbon dioxide
removal" vs. "CCs", "DAC", "Afforestation ", etc.)
|
Factors other than greenhouse gas emissions include:
|
- Feedbacks. These include CO2e emissions from permafrost thawing, surface waters,
forest dieback, peat, etc. The model defaults to using 7GtCO2 in 2100 per ℃ of warming
(e.g. this would result in 14 GtCO2e of emissions in 2100 if the temperature increased
by 2℃ in 2100). Alternatively, the user can specify values for specific years. Note
that the 2025 value is about 5GTCO2e.
- Airborne fraction. This specifies the percentage of total CO2 emissions (including
feedbacks) minus CO2 removals that are added to the atmosphere. The current model
calculated this value. A future version will allow the user to specify the
yearly values.
- Temperature spike. The global temperature unexpectedly increased significantly in
2023 and again in 2024. Climate scientists have not yet concluded whether this is
due to natural variability or to a change to the climate system.
- Mitigation'aggressiveness' for other GHG emissions. To simplify the specifications
for the GHGs other than CO2, 10 "mitigation scenarios" were developed based on the
corresponding emission trajectories in a set of ssps - one each for the radiative
forcing for CH4, N2O, and aerosols, and an "Other" for all GHGs. An 'aggressiveness'
of 1 uses the lowest amount mitigated, while a value of 10 uses the highest mitigation
amount. Values between 1 and 10 use a proportional value. Users can specify the
'aggressiveness' for each of CH4, N2O, aerosol, and other. If no value is specified
a "Default" value (calculated base on the cumulative CO2 emissions) will be used.
These radiative forcing amounts can be overridden by specifying specific yearly
values on the "Advanced RF" portion on the web form.
- Albedo. A change to the Earth's albedo was incorporated into the temperature increase
calculated by the global circulation models whose data was used to calculate the
temperature increase in this model. It appears likely that the global circulation
models underestimated the albedo change. The additional albedo needed to compensate
for the underestimate can be entered with the other "RF" group factors.
|
If the user "hovers" a mouse over most of the text on the form an explanation or
definition of the corresponding text will be displayed. In addition, clicking the
"expand" icon to the left of any "factor" will display its definition, how it was
derived (input or calculation), and (when applicable) additional information about
the factor- historical and projected values, useful references, etc. If the color
of the "expand" icon is green, up to three graphs of for the corresponding
item's values will be displayed: with the values for the various SSPs, mitigation
'aggressiveness' pathways, and/or emissions scenarios from other organizations
(International Energy Agency (IEA), MIT, and/or Climate Action Tracker).
|
Many other factors also affect the global temperature change, and this model allows
the user to specify values for most of them. These factors can be organized into
three main categories: those affecting atmospheric CO2, other greenhouse gays emissions,
and those that affect the Earth's ability to reflect the incoming sunlight (albedo).
You can input values for those factors after checking the corresponding checkbox
under the "Input" label above (CO2, RF, and SRM respectively).You can view the
calculated values for those factors by checking the corresponding checkbox under
the "Display" label above (CO2, RF, and SRM respectively).
|
SRM & CDR Explorer |
Click here to view instructions for using the SRM & CDR Explorer |
|
|
|
| Select the Graphs to Show |
| Carbon Dioxide Removal (CDR) | |
| |
|
|
Most of the text on the Web page has popup text associated with it. For example, if you hover your mouse over the text “Select the Graphs to Show”, a popup window will be displayed.
In some instances additional information can also be displayed by clicking on the text, and this will always be indicated in the popup. Note that additional popup windows and additional information will be added in future releases.
Click here to view a PDF that describes the"SRM & CDR Explorer" mode.
|
|
|
|
When the “Scenario Explorer” tab is first selected, data for a "Moderate" CO2 emissions pathway is shown in the accompanying graphs.
The emissions for this pathway are roughly in line with the CO2 emissions projected by major organizations (e.g., IEA, MIT, etc.) based on
historical emissions and likely policies that the World's nations will implement in the coming years (where CO2 emissions are not expected
drop much in the next decade or so). Note that the linear decline to emissions 5 GTCO2 is likely optimistic. This tab also assumes that the user is interested
in the efforts that would be required to reach a specific temperature increase target in 2100. The default value for this is 1.5°C,
and can be changed by checking the "Temp" checkbox to the right. Based on the selected temperature increase target the program calculates the
amount of either solar radiation management (SRM) or carbon dioxide removal (CDR) that would be required meet the target temperature increase.
(Note that for CDR the starting year defaults to 2045 and can be adjusted by checking the "CDR" checkbox to the right. There are over 30 graphs for displaying the
data associated with the emissions pathway and these can be viewed by checking the various checkboxes under the "Select the Graphs to Show" text to the right.
To compare the data for this "Moderate" CO2 emissions pathway to other projections and scenarios, click the "Down Arrow" to the above left to display the available scenarios. Most of the scenario data was
obtained from either the IPCC AR6 Report
or from the En-ROADS global climate simulator. For the former, data was based on model runs from over five years ago so their 2025 values may be off significantly.
(Total CO2 emissions were about 41.6 GTCO2 in 2024 were about and are not expected to change much in 2025. In 2025 the atmospheric concentration of CO2 is expected to hit about 427 PPM and the average global temperature increase will likely be at least 1.5°C. Keep this in mind when reviewing any of these scenarios.)
|
|
|
|
|
| Net Anthro. CO2 Emssions (GTCO2) | | |
| | | | | | | |
| Total Anthro. CO2 (GtCO2) | | |
| | | | | | | |
| | | | | Total Other CO2e (GtCO2e) | | |
| | | |
| | | Sea Level Rise Costs ($B/Yr) | | |
| | | | | |
| Carbon Removal Cost Per Ton ($/Ton) | | |
| | | Carbon Removal Cost ($B/Yr) | | |
| | | Carbon Removal (Temp Goal) (GtCO2) | | |
| | | |
Scenario Explorer: | Moderate | Click here to view instructions for using the Scenario Explorer |
| |
|
|
| Gross Anthro. CO2 | GTCO2 | |
|
|
|
|
|
|
|
|
|
|
|
|
|
|
|
|
|
|
- Anthropogenic (human caused) CO2 emissions, including those from the burning of fossil fuels, manufacturing cement, and land use changes
- User can enter values
| This graph compares the projected value (heavy black line) to the range of values from some of the SSPs. | | This graph compares the projected value (heavy black line) to other 2050 scenarios. |
|---|
|
| |
|
|
|
|
| Carbon Rmvs (Scen) | GtCO2 | |
|
|
|
|
|
|
|
|
|
|
|
|
|
|
|
|
|
|
- Carbon removal refers to all human derived techniques/process that remove CO2 from the atmopshere (CCS, DAC, mineraliation, etc.)
- User can enter values
|
|
|
| Crb Cpt&Str (CCS) | GtCO2 | |
|
|
|
|
|
|
|
|
|
|
|
|
|
|
|
|
|
|
- CCS Carbon capture and storage (CCS) refers to a collection of technologies that remove carbon dioxide (CO2) emissions from industrial processes before they enter the atmosphere. The captured CO2 can either be utilized or stored in the ground.
- Disabled for now
|
|
Additional Information |
|
Today, CCS projects are storing almost 45 million tons of CO2 every year, which is about the amount of CO2 emissions created by 10 million passenger cars. Capture generally takes place at large stationary sources of CO2, like power plants or industrial plants that make cement, steel, and chemicals. Most current carbon capture projects use a liquid to chemically remove the CO2 before it goes out the smokestack, but several new types of capture processes are under development.
The captured CO2 gas is then compressed so it becomes liquid-like and transported to a storage site, generally through a pipeline. Ship transport is more expensive than using pipelines, but it is being considered in both Europe and Japan. Once at the storage site, the CO2 is pumped more than 2,500 feet down wells into geological formations like used-up oil and gas reservoirs, as well as formations that contain unusable, salty water. (https://climate.mit.edu/explainers/carbon-capture)
|
|
|
|
| Dir Air Capt (DAC) | GtCO2 | |
|
|
|
|
|
|
|
|
|
|
|
|
|
|
|
|
|
|
- Direct air capture (DAC) includes a suite of technologies that remove carbon dioxide (CO2) from the atmosphere using chemical or physical processes
- Disabled for now
|
|
Additional Information |
|
Direct Air Capture (DAC) is a technology designed to remove carbon dioxide (CO₂)
directly from the atmosphere to help mitigate climate change. Unlike other
methods of carbon capture, which focus on emissions from industrial sources, DAC
works by capturing CO₂ that is already in the air.
Here’s how DAC generally works:
- Air Intake: Large fans or other methods pull ambient air into a
system.
- CO₂ Capture: The air passes through a chemical solution or
solid sorbent that binds with the carbon dioxide molecules. There are two
primary types of DAC technologies:
- Liquid-based DAC: Uses chemical solvents that capture CO₂ when
the air passes through.
- Solid-based DAC: Uses solid materials or filters to absorb CO₂.
- CO₂ Release: The captured CO₂ is then isolated from the
material it is bound to, usually through heating or applying a vacuum.
- Storage or Utilization: The CO₂ is either stored underground
(in geological formations like depleted oil fields or deep saline aquifers) or
used in products like synthetic fuels or building materials.
DAC is seen as a potentially important tool for reducing atmospheric CO₂,
especially in cases where it’s not feasible to reduce emissions at the source.
While the technology is still in development, several pilot projects and
commercial operations are working to scale DAC and make it more efficient and
cost-effective. (source: ChatGPT)
|
|
|
|
| Afforestation | GtCO2 | |
|
|
|
|
|
|
|
|
|
|
|
|
|
|
|
|
|
|
- Afforestation is the process of planting trees in an area where there were none previously, with the goal of creating a new forest or woodland. It is a key strategy in combating climate change, as trees absorb carbon dioxide (CO2) from the atmosphere through photosynthesis, helping to reduce the overall concentration of greenhouse gases. (Source: ChatGPT)
- Disabled for now
|
|
Additional Information |
How Afforestation Works:
- Selecting Land: The first step is to identify suitable land for
planting trees. This could be land that was once forested but has been cleared
(e.g., for agriculture) or land that has never been forested.
- Choosing Species: The right species of trees are selected based
on the climate, soil type, and the purpose of the afforestation project (e.g.,
carbon sequestration, biodiversity enhancement).
- Planting Trees: The trees are planted, and in some cases, the
soil is prepared to ensure better growth conditions. This can involve removing
invasive species or improving soil quality.
- Ongoing Maintenance: Regular monitoring and care are required
to ensure the trees grow successfully, which may involve watering, controlling
pests, or protecting them from wildfires.
Benefits of Afforestation:
- Carbon Sequestration: As trees grow, they absorb and store
carbon dioxide, helping mitigate the effects of climate change.
- Biodiversity: Afforestation can restore ecosystems and create
habitats for wildlife, enhancing biodiversity.
- Soil Protection: Forests help prevent soil erosion, improve
water retention, and contribute to healthier soil by adding organic matter.
- Water Cycle Regulation: Trees play a role in the local water
cycle, influencing rainfall patterns and groundwater levels.
- Economic Benefits: Forests can provide timber, fuel, and other
resources that benefit local communities economically.
However, afforestation must be carefully planned. If done inappropriately (e.g.,
planting non-native species or on ecologically sensitive land), it can have
negative environmental impacts, such as disrupting local ecosystems or reducing
water availability for other plants and animals. (source: ChatGPT)
|
|
|
|
| Mineralization | GtCO2 | |
|
|
|
|
|
|
|
|
|
|
|
|
|
|
|
|
|
|
- Mineralization is a process in which carbon dioxide (CO2) is chemically transformed into stable mineral compounds, such as carbonates, through natural or engineered reactions. This is a form of carbon capture and storage (CCS), aimed at mitigating climate change by permanently removing CO2 from the atmosphere or industrial processes. (source: ChatGP
- Disabled for now
|
|
Additional Information |
How Mineralization Works:
-
Capture of CO₂: CO₂ is captured either directly from the air
(via direct air capture) or from industrial emissions (e.g., power plants).
-
Reaction with Minerals: The captured CO₂ is then exposed to
naturally occurring minerals that contain metal cations (like calcium,
magnesium, or iron). These minerals, such as olivine or basalt, can chemically
react with CO₂ in the presence of water.
A common reaction might be:
CO2+CaSiO3(forsterite)→CaCO3(calcite)+SiO2(silica)
This converts CO₂ into solid carbonates (like calcium carbonate, or CaCO₃),
which are stable and non-toxic.
-
Storage: The resulting solid mineral carbonates are stable and
can be stored safely for millions of years, essentially locking away CO₂ from
the atmosphere in a permanent form.
Types of Mineralization:
-
Enhanced Weathering: This involves accelerating the natural
weathering process, where minerals in rocks slowly react with CO₂. By breaking
down rocks more quickly (often through mechanical or chemical means), the rate
at which CO₂ is captured and mineralized can be increased.
-
In situ Mineralization: This refers to the natural process of
mineralization that occurs underground. CO₂ is injected into geological
formations, such as basalt rock formations, where it reacts with the minerals
present to form carbonates.
-
Ex situ Mineralization: This is a more engineered process,
where CO₂ is captured, transported, and then reacted with minerals in a
controlled environment, typically in reactors or mines, before being stored.
Benefits of Mineralization:
- Permanent CO₂ Storage: The mineralized carbonates are stable
for millions of years, offering a long-term solution to climate change.
- Natural Process: Mineralization mimics natural processes,
making it a relatively safe and predictable way of storing carbon.
- Scalability: There is potential for scaling this process to
large volumes, as many types of minerals on Earth can react with CO₂.
- Economic Value: The byproducts, such as carbonates, can have
commercial uses (e.g., in construction materials, agriculture, or even as a
component of cement), potentially offsetting some of the costs.
Challenges:
- Speed: Natural mineralization is a slow process. Research is
ongoing to find ways to speed up the chemical reactions.
- Energy Intensity: Some methods of mineralization, especially ex
situ processes, may require significant energy inputs.
- Geological Site Availability: Suitable geological sites for in
situ mineralization may not be available everywhere, and transporting CO₂ to
these sites can be costly.
Mineralization holds great promise as a long-term, stable solution for reducing
atmospheric CO₂ levels and combating climate change. (source: ChatGPT)
|
|
|
|
| Agricult Soil Carb | GtCO2 | |
|
|
|
|
|
|
|
|
|
|
|
|
|
|
|
|
|
|
- Agricultural soil carbon refers to the carbon stored in the soil as part of the soil organic matter (SOM), which includes plant roots, decomposing plant and animal residues, and microbial biomass. This carbon plays a critical role in maintaining soil health, fertility, and structure, and can contribute significantly to mitigating climate change if managed effectively. (source: ChatGPT)
- Disabled for now
|
|
Additional Information |
ypes of Agricultural Soil Carbon:
- Soil Organic Carbon (SOC): This is the carbon component of soil
organic matter, derived from plant and animal residues that have decomposed in
the soil.
- Soil Inorganic Carbon (SIC): This is carbon that is bound in
mineral forms, like carbonates (e.g., calcium carbonate), found in certain
soils.
Most carbon stored in soils is in the organic form, and it is a key factor in
determining soil health and productivity.
How Agricultural Soil Carbon Works:
Soil carbon is part of the carbon cycle, where plants capture
atmospheric CO₂ during photosynthesis and then incorporate it into their
tissues. When plants die, this carbon is transferred into the soil through root
systems or through the decomposition of organic matter. Soil organisms (like
bacteria, fungi, and earthworms) break down this organic material, which
contributes to carbon being stored in the soil.
Key processes that influence soil carbon storage include:
- Photosynthesis: Plants absorb CO₂ from the atmosphere and
convert it into organic carbon compounds.
- Decomposition: As plant residues decompose, carbon is either
released back into the atmosphere as CO₂ or retained in the soil as part of
organic matter.
- Soil Formation and Erosion: The way soil is formed or disturbed
can affect the amount of carbon stored in the soil.
Benefits of Agricultural Soil Carbon:
- Carbon Sequestration: Soils can store large amounts of carbon
over long periods, effectively acting as carbon sinks, which helps to reduce
atmospheric CO₂ and mitigate climate change.
- Soil Fertility and Productivity: Soil organic carbon is
essential for soil fertility, as it improves soil structure, water retention,
nutrient availability, and microbial activity, all of which contribute to better
crop yields.
- Resilience to Drought: Higher soil carbon content can improve
the soil's ability to retain water, making crops more resilient to drought
conditions.
- Improved Soil Structure: The organic matter in soil improves
its structure, reducing compaction and enhancing aeration, which is beneficial
for plant growth.
- Biodiversity: Healthy soils with abundant carbon tend to
support a diverse range of microorganisms, which contribute to nutrient cycling
and soil health.
Practices for Increasing Agricultural Soil Carbon:
Several sustainable agricultural practices can increase soil carbon storage,
including:
- Cover Cropping: Planting crops that cover the soil during
fallow periods can prevent erosion and increase organic matter inputs to the
soil.
- Reduced Tillage: Minimizing tillage reduces soil disturbance,
preserving soil structure and preventing the release of carbon stored in the
soil.
- Agroforestry: Integrating trees and shrubs into agricultural
landscapes increases carbon sequestration through both above-ground biomass and
soil organic carbon.
- Crop Rotation: Growing a variety of crops instead of
monocultures helps improve soil health and increase carbon retention.
- Organic Amendments: Adding organic materials like compost,
manure, or biochar can increase soil carbon levels.
- Pasture Management: Rotational grazing and improving pasture
management can enhance carbon storage in grasslands.
Challenges and Considerations:
- Soil Type and Climate: The potential for soil carbon
sequestration varies by soil type, climate, and land management practices. Some
soils are naturally more conducive to storing carbon than others.
- Soil Erosion: Erosion can deplete soil carbon by washing away
topsoil, where most organic carbon is stored.
- Long-Term Commitment: Soil carbon sequestration takes time and
requires sustained management practices over years to decades.
- Balance with Crop Production: Some practices that increase soil
carbon may reduce immediate crop yields, so farmers must balance carbon storage
with their economic needs.
Soil Carbon in the Context of Climate Change:
Agricultural soils have the potential to be a significant part of climate change
mitigation strategies. If managed effectively, they can sequester vast amounts
of carbon and help offset emissions from other sectors. However, the permanence
of carbon stored in soils is subject to management practices, land use changes,
and natural factors like climate shifts.
Overall, increasing soil carbon content is a win-win for agriculture and climate
mitigation, improving soil health and supporting sustainable farming practices
while contributing to global carbon reduction efforts. (source: ChatGPT)
|
|
|
|
| Biochar | GtCO2 | |
|
|
|
|
|
|
|
|
|
|
|
|
|
|
|
|
|
|
- Biochar is considered a promising technology for carbon sequestration and combating climate change. The carbon stored in biochar remains stable in the soil for centuries or longer, and its use in agriculture can help reduce CO2 levels in the atmosphere. Because biochar is produced from renewable biomass, it can also contribute to a circular economy, where waste materials are turned into valuable products rather than being discarded or burned.(source: ChatGPT)
- Disabled for now
|
|
Additional Information |
How Biochar Is Made:
- Feedstock Selection: Biochar is made from organic materials
like crop residues, wood chips, manure, or other biomass. The type of feedstock
can influence the properties of the biochar.
- Pyrolysis: The feedstock is heated in a sealed container
(called a pyrolysis reactor) in the absence of oxygen, typically at temperatures
between 350°C and 700°C (662°F and 1292°F). This process breaks down the organic
material and results in solid biochar, along with gases and oils, which can be
captured and used as energy or in other processes.
- Cooling and Processing: The biochar is cooled, and any
remaining gases are captured for energy production. The resulting biochar can be
ground to different particle sizes depending on its intended use.
Properties of Biochar:
- High Carbon Content: Biochar is rich in carbon, often
comprising over 70% of its composition, making it a stable form of carbon
storage.
- Porous Structure: Biochar has a highly porous structure, which
increases its surface area and allows it to retain water and nutrients.
- Stability: Biochar is stable in soil for hundreds or even
thousands of years, making it an effective way to sequester carbon and reduce
atmospheric CO₂.
Benefits of Biochar:
- Carbon Sequestration: Biochar is a form of carbon
capture and storage (CCS). When it is applied to soils, it locks away
carbon for long periods, helping to mitigate climate change by removing CO₂ from
the atmosphere.
- Soil Improvement: Adding biochar to soil can enhance its
fertility by improving its structure, water retention, and nutrient-holding
capacity. This makes it particularly valuable in soils that are degraded or have
poor organic matter content.
- Enhanced Plant Growth: The porous structure of biochar helps
soil retain moisture and nutrients, which can improve plant growth, especially
in areas with drought conditions or poor soil quality.
- Soil pH Regulation: Biochar can help balance soil pH,
especially in acidic soils, making the soil more favorable for plant growth.
- Reduction in Greenhouse Gas Emissions: Biochar has been shown
to reduce emissions of nitrous oxide (N₂O) and methane (CH₄) from soils, both of
which are potent greenhouse gases.
- Waste Management: Biochar can be produced from agricultural,
forestry, or industrial waste products, providing a sustainable way to recycle
biomass that would otherwise be discarded or burned.
- Water Filtration: Due to its porous nature, biochar can be used
for water filtration, removing contaminants like heavy metals and organic
compounds from water.
Applications of Biochar:
- Agriculture: Biochar is widely used as a soil amendment to
improve soil health, fertility, and crop yields. It is especially beneficial for
soils with low organic matter or poor structure.
- Carbon Sequestration: Applied to soils, biochar serves as a
long-term carbon sink, helping to mitigate the effects of climate change.
- Waste-to-Energy: The pyrolysis process used to create biochar
also generates bio-oils and gases that can be used as renewable energy sources,
making the production of biochar part of a circular economy.
- Water Treatment: Biochar is being explored as an effective
material for filtering contaminants from water, as it can adsorb toxins and
other pollutants.
- Building Materials: Some biochars, due to their properties, are
being experimented with as an additive to construction materials like cement and
concrete, providing both environmental and practical benefits.
Challenges and Considerations:
- Energy Requirements: The pyrolysis process requires energy, and
while some of this energy can be captured and used, the overall energy balance
of biochar production depends on the technology and feedstocks used.
- Scale of Production: While biochar has significant potential,
scaling up production to a level that makes a global impact on climate change
requires overcoming logistical and economic challenges.
- Feedstock Availability: The availability and sustainability of
biomass feedstocks can limit biochar production. It’s important to ensure that
feedstocks are sourced in an environmentally responsible manner without
competing with food production or causing deforestation.
- Potential Soil Effects: While biochar can improve soil quality,
the effects can vary based on the type of soil, the specific biochar used, and
the amount applied. In some cases, improper use may have negative effects, such
as altering soil nutrient balances.
Biochar and Climate Change:
Biochar is considered a promising technology for carbon sequestration
and combating climate change. The carbon stored in biochar remains stable in the
soil for centuries or longer, and its use in agriculture can help reduce CO₂
levels in the atmosphere. Because biochar is produced from renewable biomass, it
can also contribute to a circular economy, where waste
materials are turned into valuable products rather than being discarded or
burned.
In summary, biochar has the potential to provide multiple environmental
benefits, from improving soil health and agricultural productivity to serving as
a long-term carbon sink that helps mitigate climate change. However, it requires
careful management and scaling to fully realize its potential.
(source: ChatGPT)
|
|
|
|
| Ocenanic Removal | GtCO2 | |
|
|
|
|
|
|
|
|
|
|
|
|
|
|
|
|
|
|
- Oceanic removal (or ocean carbon removal - mCDR)) refers to strategies and technologies aimed at removing carbon dioxide (CO2) from the atmosphere and sequestering it in the ocean. The ocean is a major carbon sink, absorbing about 25% of global CO2 emissions. However, oceanic removal focuses on enhancing this natural process or directly removing carbon from the atmosphere and storing it in ocean ecosystems or geological formations beneath the ocean. (source: ChatGPT)
- Disabled for now
|
|
Additional Information |
|
(source: ChatGPT)
|
|
|
|
| CCS, BECCS, etc. | GtCO2 | |
|
|
|
|
|
|
|
|
|
|
|
|
|
|
|
|
|
|
- CO2 Emissions captured at the source
- User can enter values
| This graph compares the projected value (heavy black line) to the range of values from some of the SSPs. | |
|---|
|
| |
|
|
|
| Carbon Feedbacks | GtCO2 | |
|
|
|
|
|
|
|
|
|
|
|
|
|
|
|
|
|
|
- Climate feedbacks refer to processes that can amplify or dampen the effects of climate change. These feedbacks are mechanisms that occur as a result of the changing climate itself and either reinforce or mitigate the initial changes caused by human activities, such as the burning of fossil fuels. (source: ChatGPT)
- User can enter values
|
|
Additional Information |
|
(source: ChatGPT)
|
|
|
- CCS Carbon capture and storage (CCS) refers to a collection of technologies that remove carbon dioxide (CO2) emissions from industrial processes before they enter the atmosphere. The captured CO2 can either be utilized or stored in the ground.
- Disabled for now
|
|
Additional Information |
|
Today, CCS projects are storing almost 45 million tons of CO2 every year, which is about the amount of CO2 emissions created by 10 million passenger cars. Capture generally takes place at large stationary sources of CO2, like power plants or industrial plants that make cement, steel, and chemicals. Most current carbon capture projects use a liquid to chemically remove the CO2 before it goes out the smokestack, but several new types of capture processes are under development.
The captured CO2 gas is then compressed so it becomes liquid-like and transported to a storage site, generally through a pipeline. Ship transport is more expensive than using pipelines, but it is being considered in both Europe and Japan. Once at the storage site, the CO2 is pumped more than 2,500 feet down wells into geological formations like used-up oil and gas reservoirs, as well as formations that contain unusable, salty water. (https://climate.mit.edu/explainers/carbon-capture)
|
|
|
- Direct air capture (DAC) includes a suite of technologies that remove carbon dioxide (CO2) from the atmosphere using chemical or physical processes
- Disabled for now
|
|
Additional Information |
|
Direct Air Capture (DAC) is a technology designed to remove carbon dioxide (CO₂)
directly from the atmosphere to help mitigate climate change. Unlike other
methods of carbon capture, which focus on emissions from industrial sources, DAC
works by capturing CO₂ that is already in the air.
Here’s how DAC generally works:
- Air Intake: Large fans or other methods pull ambient air into a
system.
- CO₂ Capture: The air passes through a chemical solution or
solid sorbent that binds with the carbon dioxide molecules. There are two
primary types of DAC technologies:
- Liquid-based DAC: Uses chemical solvents that capture CO₂ when
the air passes through.
- Solid-based DAC: Uses solid materials or filters to absorb CO₂.
- CO₂ Release: The captured CO₂ is then isolated from the
material it is bound to, usually through heating or applying a vacuum.
- Storage or Utilization: The CO₂ is either stored underground
(in geological formations like depleted oil fields or deep saline aquifers) or
used in products like synthetic fuels or building materials.
DAC is seen as a potentially important tool for reducing atmospheric CO₂,
especially in cases where it’s not feasible to reduce emissions at the source.
While the technology is still in development, several pilot projects and
commercial operations are working to scale DAC and make it more efficient and
cost-effective. (source: ChatGPT)
|
|
|
- Afforestation is the process of planting trees in an area where there were none previously, with the goal of creating a new forest or woodland. It is a key strategy in combating climate change, as trees absorb carbon dioxide (CO2) from the atmosphere through photosynthesis, helping to reduce the overall concentration of greenhouse gases. (Source: ChatGPT)
- Disabled for now
|
|
Additional Information |
How Afforestation Works:
- Selecting Land: The first step is to identify suitable land for
planting trees. This could be land that was once forested but has been cleared
(e.g., for agriculture) or land that has never been forested.
- Choosing Species: The right species of trees are selected based
on the climate, soil type, and the purpose of the afforestation project (e.g.,
carbon sequestration, biodiversity enhancement).
- Planting Trees: The trees are planted, and in some cases, the
soil is prepared to ensure better growth conditions. This can involve removing
invasive species or improving soil quality.
- Ongoing Maintenance: Regular monitoring and care are required
to ensure the trees grow successfully, which may involve watering, controlling
pests, or protecting them from wildfires.
Benefits of Afforestation:
- Carbon Sequestration: As trees grow, they absorb and store
carbon dioxide, helping mitigate the effects of climate change.
- Biodiversity: Afforestation can restore ecosystems and create
habitats for wildlife, enhancing biodiversity.
- Soil Protection: Forests help prevent soil erosion, improve
water retention, and contribute to healthier soil by adding organic matter.
- Water Cycle Regulation: Trees play a role in the local water
cycle, influencing rainfall patterns and groundwater levels.
- Economic Benefits: Forests can provide timber, fuel, and other
resources that benefit local communities economically.
However, afforestation must be carefully planned. If done inappropriately (e.g.,
planting non-native species or on ecologically sensitive land), it can have
negative environmental impacts, such as disrupting local ecosystems or reducing
water availability for other plants and animals. (source: ChatGPT)
|
|
|
- Mineralization is a process in which carbon dioxide (CO2) is chemically transformed into stable mineral compounds, such as carbonates, through natural or engineered reactions. This is a form of carbon capture and storage (CCS), aimed at mitigating climate change by permanently removing CO2 from the atmosphere or industrial processes. (source: ChatGP
- Disabled for now
|
|
Additional Information |
How Mineralization Works:
-
Capture of CO₂: CO₂ is captured either directly from the air
(via direct air capture) or from industrial emissions (e.g., power plants).
-
Reaction with Minerals: The captured CO₂ is then exposed to
naturally occurring minerals that contain metal cations (like calcium,
magnesium, or iron). These minerals, such as olivine or basalt, can chemically
react with CO₂ in the presence of water.
A common reaction might be:
CO2+CaSiO3(forsterite)→CaCO3(calcite)+SiO2(silica)
This converts CO₂ into solid carbonates (like calcium carbonate, or CaCO₃),
which are stable and non-toxic.
-
Storage: The resulting solid mineral carbonates are stable and
can be stored safely for millions of years, essentially locking away CO₂ from
the atmosphere in a permanent form.
Types of Mineralization:
-
Enhanced Weathering: This involves accelerating the natural
weathering process, where minerals in rocks slowly react with CO₂. By breaking
down rocks more quickly (often through mechanical or chemical means), the rate
at which CO₂ is captured and mineralized can be increased.
-
In situ Mineralization: This refers to the natural process of
mineralization that occurs underground. CO₂ is injected into geological
formations, such as basalt rock formations, where it reacts with the minerals
present to form carbonates.
-
Ex situ Mineralization: This is a more engineered process,
where CO₂ is captured, transported, and then reacted with minerals in a
controlled environment, typically in reactors or mines, before being stored.
Benefits of Mineralization:
- Permanent CO₂ Storage: The mineralized carbonates are stable
for millions of years, offering a long-term solution to climate change.
- Natural Process: Mineralization mimics natural processes,
making it a relatively safe and predictable way of storing carbon.
- Scalability: There is potential for scaling this process to
large volumes, as many types of minerals on Earth can react with CO₂.
- Economic Value: The byproducts, such as carbonates, can have
commercial uses (e.g., in construction materials, agriculture, or even as a
component of cement), potentially offsetting some of the costs.
Challenges:
- Speed: Natural mineralization is a slow process. Research is
ongoing to find ways to speed up the chemical reactions.
- Energy Intensity: Some methods of mineralization, especially ex
situ processes, may require significant energy inputs.
- Geological Site Availability: Suitable geological sites for in
situ mineralization may not be available everywhere, and transporting CO₂ to
these sites can be costly.
Mineralization holds great promise as a long-term, stable solution for reducing
atmospheric CO₂ levels and combating climate change. (source: ChatGPT)
|
|
|
- Agricultural soil carbon refers to the carbon stored in the soil as part of the soil organic matter (SOM), which includes plant roots, decomposing plant and animal residues, and microbial biomass. This carbon plays a critical role in maintaining soil health, fertility, and structure, and can contribute significantly to mitigating climate change if managed effectively. (source: ChatGPT)
- Disabled for now
|
|
Additional Information |
ypes of Agricultural Soil Carbon:
- Soil Organic Carbon (SOC): This is the carbon component of soil
organic matter, derived from plant and animal residues that have decomposed in
the soil.
- Soil Inorganic Carbon (SIC): This is carbon that is bound in
mineral forms, like carbonates (e.g., calcium carbonate), found in certain
soils.
Most carbon stored in soils is in the organic form, and it is a key factor in
determining soil health and productivity.
How Agricultural Soil Carbon Works:
Soil carbon is part of the carbon cycle, where plants capture
atmospheric CO₂ during photosynthesis and then incorporate it into their
tissues. When plants die, this carbon is transferred into the soil through root
systems or through the decomposition of organic matter. Soil organisms (like
bacteria, fungi, and earthworms) break down this organic material, which
contributes to carbon being stored in the soil.
Key processes that influence soil carbon storage include:
- Photosynthesis: Plants absorb CO₂ from the atmosphere and
convert it into organic carbon compounds.
- Decomposition: As plant residues decompose, carbon is either
released back into the atmosphere as CO₂ or retained in the soil as part of
organic matter.
- Soil Formation and Erosion: The way soil is formed or disturbed
can affect the amount of carbon stored in the soil.
Benefits of Agricultural Soil Carbon:
- Carbon Sequestration: Soils can store large amounts of carbon
over long periods, effectively acting as carbon sinks, which helps to reduce
atmospheric CO₂ and mitigate climate change.
- Soil Fertility and Productivity: Soil organic carbon is
essential for soil fertility, as it improves soil structure, water retention,
nutrient availability, and microbial activity, all of which contribute to better
crop yields.
- Resilience to Drought: Higher soil carbon content can improve
the soil's ability to retain water, making crops more resilient to drought
conditions.
- Improved Soil Structure: The organic matter in soil improves
its structure, reducing compaction and enhancing aeration, which is beneficial
for plant growth.
- Biodiversity: Healthy soils with abundant carbon tend to
support a diverse range of microorganisms, which contribute to nutrient cycling
and soil health.
Practices for Increasing Agricultural Soil Carbon:
Several sustainable agricultural practices can increase soil carbon storage,
including:
- Cover Cropping: Planting crops that cover the soil during
fallow periods can prevent erosion and increase organic matter inputs to the
soil.
- Reduced Tillage: Minimizing tillage reduces soil disturbance,
preserving soil structure and preventing the release of carbon stored in the
soil.
- Agroforestry: Integrating trees and shrubs into agricultural
landscapes increases carbon sequestration through both above-ground biomass and
soil organic carbon.
- Crop Rotation: Growing a variety of crops instead of
monocultures helps improve soil health and increase carbon retention.
- Organic Amendments: Adding organic materials like compost,
manure, or biochar can increase soil carbon levels.
- Pasture Management: Rotational grazing and improving pasture
management can enhance carbon storage in grasslands.
Challenges and Considerations:
- Soil Type and Climate: The potential for soil carbon
sequestration varies by soil type, climate, and land management practices. Some
soils are naturally more conducive to storing carbon than others.
- Soil Erosion: Erosion can deplete soil carbon by washing away
topsoil, where most organic carbon is stored.
- Long-Term Commitment: Soil carbon sequestration takes time and
requires sustained management practices over years to decades.
- Balance with Crop Production: Some practices that increase soil
carbon may reduce immediate crop yields, so farmers must balance carbon storage
with their economic needs.
Soil Carbon in the Context of Climate Change:
Agricultural soils have the potential to be a significant part of climate change
mitigation strategies. If managed effectively, they can sequester vast amounts
of carbon and help offset emissions from other sectors. However, the permanence
of carbon stored in soils is subject to management practices, land use changes,
and natural factors like climate shifts.
Overall, increasing soil carbon content is a win-win for agriculture and climate
mitigation, improving soil health and supporting sustainable farming practices
while contributing to global carbon reduction efforts. (source: ChatGPT)
|
|
|
- Biochar is considered a promising technology for carbon sequestration and combating climate change. The carbon stored in biochar remains stable in the soil for centuries or longer, and its use in agriculture can help reduce CO2 levels in the atmosphere. Because biochar is produced from renewable biomass, it can also contribute to a circular economy, where waste materials are turned into valuable products rather than being discarded or burned.(source: ChatGPT)
- Disabled for now
|
|
Additional Information |
How Biochar Is Made:
- Feedstock Selection: Biochar is made from organic materials
like crop residues, wood chips, manure, or other biomass. The type of feedstock
can influence the properties of the biochar.
- Pyrolysis: The feedstock is heated in a sealed container
(called a pyrolysis reactor) in the absence of oxygen, typically at temperatures
between 350°C and 700°C (662°F and 1292°F). This process breaks down the organic
material and results in solid biochar, along with gases and oils, which can be
captured and used as energy or in other processes.
- Cooling and Processing: The biochar is cooled, and any
remaining gases are captured for energy production. The resulting biochar can be
ground to different particle sizes depending on its intended use.
Properties of Biochar:
- High Carbon Content: Biochar is rich in carbon, often
comprising over 70% of its composition, making it a stable form of carbon
storage.
- Porous Structure: Biochar has a highly porous structure, which
increases its surface area and allows it to retain water and nutrients.
- Stability: Biochar is stable in soil for hundreds or even
thousands of years, making it an effective way to sequester carbon and reduce
atmospheric CO₂.
Benefits of Biochar:
- Carbon Sequestration: Biochar is a form of carbon
capture and storage (CCS). When it is applied to soils, it locks away
carbon for long periods, helping to mitigate climate change by removing CO₂ from
the atmosphere.
- Soil Improvement: Adding biochar to soil can enhance its
fertility by improving its structure, water retention, and nutrient-holding
capacity. This makes it particularly valuable in soils that are degraded or have
poor organic matter content.
- Enhanced Plant Growth: The porous structure of biochar helps
soil retain moisture and nutrients, which can improve plant growth, especially
in areas with drought conditions or poor soil quality.
- Soil pH Regulation: Biochar can help balance soil pH,
especially in acidic soils, making the soil more favorable for plant growth.
- Reduction in Greenhouse Gas Emissions: Biochar has been shown
to reduce emissions of nitrous oxide (N₂O) and methane (CH₄) from soils, both of
which are potent greenhouse gases.
- Waste Management: Biochar can be produced from agricultural,
forestry, or industrial waste products, providing a sustainable way to recycle
biomass that would otherwise be discarded or burned.
- Water Filtration: Due to its porous nature, biochar can be used
for water filtration, removing contaminants like heavy metals and organic
compounds from water.
Applications of Biochar:
- Agriculture: Biochar is widely used as a soil amendment to
improve soil health, fertility, and crop yields. It is especially beneficial for
soils with low organic matter or poor structure.
- Carbon Sequestration: Applied to soils, biochar serves as a
long-term carbon sink, helping to mitigate the effects of climate change.
- Waste-to-Energy: The pyrolysis process used to create biochar
also generates bio-oils and gases that can be used as renewable energy sources,
making the production of biochar part of a circular economy.
- Water Treatment: Biochar is being explored as an effective
material for filtering contaminants from water, as it can adsorb toxins and
other pollutants.
- Building Materials: Some biochars, due to their properties, are
being experimented with as an additive to construction materials like cement and
concrete, providing both environmental and practical benefits.
Challenges and Considerations:
- Energy Requirements: The pyrolysis process requires energy, and
while some of this energy can be captured and used, the overall energy balance
of biochar production depends on the technology and feedstocks used.
- Scale of Production: While biochar has significant potential,
scaling up production to a level that makes a global impact on climate change
requires overcoming logistical and economic challenges.
- Feedstock Availability: The availability and sustainability of
biomass feedstocks can limit biochar production. It’s important to ensure that
feedstocks are sourced in an environmentally responsible manner without
competing with food production or causing deforestation.
- Potential Soil Effects: While biochar can improve soil quality,
the effects can vary based on the type of soil, the specific biochar used, and
the amount applied. In some cases, improper use may have negative effects, such
as altering soil nutrient balances.
Biochar and Climate Change:
Biochar is considered a promising technology for carbon sequestration
and combating climate change. The carbon stored in biochar remains stable in the
soil for centuries or longer, and its use in agriculture can help reduce CO₂
levels in the atmosphere. Because biochar is produced from renewable biomass, it
can also contribute to a circular economy, where waste
materials are turned into valuable products rather than being discarded or
burned.
In summary, biochar has the potential to provide multiple environmental
benefits, from improving soil health and agricultural productivity to serving as
a long-term carbon sink that helps mitigate climate change. However, it requires
careful management and scaling to fully realize its potential.
(source: ChatGPT)
|
|
|
- Oceanic removal (or ocean carbon removal - mCDR)) refers to strategies and technologies aimed at removing carbon dioxide (CO2) from the atmosphere and sequestering it in the ocean. The ocean is a major carbon sink, absorbing about 25% of global CO2 emissions. However, oceanic removal focuses on enhancing this natural process or directly removing carbon from the atmosphere and storing it in ocean ecosystems or geological formations beneath the ocean. (source: ChatGPT)
- Disabled for now
|
|
Additional Information |
|
(source: ChatGPT)
|
|
|
- Anthropogenic (human caused) CO2 emissions, including those from the burning of fossil fuels, manufacturing cement, and land use changes
- User can enter values
| This graph compares the projected value (heavy black line) to the range of values from some of the SSPs. | | This graph compares the projected value (heavy black line) to other 2050 scenarios. |
|---|
|
| |
|
|
|
- Carbon removal refers to all human derived techniques/process that remove CO2 from the atmopshere (CCS, DAC, mineraliation, etc.)
- User can enter values
|
|
- CO2 Emissions captured at the source
- User can enter values
| This graph compares the projected value (heavy black line) to the range of values from some of the SSPs. | |
|---|
|
| |
|
|
- Total Anthro CO2
- Calcuated: The sum of all CO2 emissions and removals
|
|
- Climate feedbacks refer to processes that can amplify or dampen the effects of climate change. These feedbacks are mechanisms that occur as a result of the changing climate itself and either reinforce or mitigate the initial changes caused by human activities, such as the burning of fossil fuels. (source: ChatGPT)
- User can enter values
|
|
Additional Information |
|
(source: ChatGPT)
|
|
|
- Adjustment to CO2 so that the calculated "CO2 PPM" matches the scenario's CO2 PPM value when the scenario's data is first loaded
- Only calcuated when the data for the scenario includes the CO2 PPM
|
|
- Total Net CO2
- Calcuated: The sum of all CO2 emissions and removals
|
|
- Cumulative Anthropogenic CO2 emissions after the year 2024
- Calcuated: Cumulative CO2 removed after the year 2024
|
|
- Cumulative FeedbackCO2 emissions after the year 2024
- Calcuated: Cumulative Feedback CO2 emissions after the year 2024
|
|
- Cumulative Carbon Removed after the year 2024
- Calcuated: Anthropogenic CO2 emissions after the year 2024
|
|
- Cumulative CO2 emissions after the year 2024
- Calcuated: Cumulative CO2 emissions after the year 2024
|
|
- The airborne fraction (AF) refers to the portion of carbon dioxide (CO2) emitted into the atmosphere that remains in the atmosphere, rather than being absorbed by natural carbon sinks such as oceans, forests, and soils. In simpler terms, it is the fraction of CO2 emissions that do not get sequestered by these natural systems and therefore contribute to the accumulation of atmospheric CO2, which is a primary driver of climate change. (source:ChatGPT) (Note: a value is not displayed if 'total net CO2 emissions are zero or less)
- Calcuated: CO2 to atmosphere/total net CO2
|
|
Additional Information |
|
Formula: Airborne Fraction = CO2 Added to Atmpshere/Total CO2 Emissions
Key Points:
- The airborne fraction represents the ratio of the CO₂ that stays in the
atmosphere after emission.
- It is influenced by the ability of carbon sinks (such as
forests, oceans, and soils) to absorb CO₂. If carbon sinks are efficient, the
airborne fraction will be lower because a greater proportion of the emitted CO₂
will be absorbed.
- Over time, the airborne fraction can change based on factors like:
- Land use and forest management practices.
- Ocean health, particularly how much CO₂ the oceans can absorb.
- Climate and weather patterns, which can influence carbon sink
efficiency.
Historical Trends:
- Historically, the airborne fraction has increased over time. This means that a
growing proportion of the CO₂ emissions caused by human activities (such as
burning fossil fuels) is staying in the atmosphere, contributing to the rise in
global temperatures.
- For example, between 1959 and 2019, the airborne fraction has risen from about
40% to around 45% of the total CO₂ emissions, indicating that natural carbon
sinks (e.g., forests, oceans) have not been able to absorb as much CO₂ as they
did in the past, partly due to factors like deforestation and ocean
acidification.
Factors Influencing the Airborne Fraction:
-
Capacity of Carbon Sinks:
- The Earth’s natural systems, like forests, soil, and oceans, act as
carbon sinks that absorb a significant amount of the emitted CO₂.
However, their capacity to absorb CO₂ can vary over time.
- Ocean acidification and deforestation are two
significant factors that can reduce the efficiency of these carbon sinks,
leading to a higher airborne fraction.
- Forest degradation and reduced vegetation also lower the
capacity for CO₂ uptake.
-
Emissions Trends:
- The rate of CO₂ emissions has increased sharply, particularly
since the industrial revolution. Higher emissions mean that, even if sinks
remain stable, the absolute amount of CO₂ that stays in the atmosphere
increases.
-
Climate Change Feedbacks:
- Warming temperatures may reduce the efficiency of natural
carbon sinks. For example, warmer oceans are less efficient at absorbing CO₂,
and warmer temperatures can increase the release of CO₂ from soils and
permafrost.
- Forest fires, droughts, and other extreme
weather events can disrupt the ability of ecosystems to absorb CO₂.
Why the Airborne Fraction Matters:
- Climate Change Impact: The airborne fraction is a critical
metric for understanding how much of human CO₂ emissions are contributing to the
greenhouse effect and, by extension, to climate change. As the airborne fraction
increases, more CO₂ stays in the atmosphere, leading to faster global warming.
- Policy and Mitigation: Knowing the airborne fraction helps
inform climate policy and mitigation strategies. If the airborne fraction is
high, there may be a greater need for carbon removal technologies
(e.g., afforestation, direct air capture) to offset emissions that are not being
absorbed by natural sinks.
- Carbon Budget: The concept of a carbon budget
is closely related to the airborne fraction. It refers to the total amount of
CO₂ that can be emitted into the atmosphere before global temperature rises
beyond a certain threshold, typically 1.5°C or 2°C above pre-industrial levels.
As the airborne fraction increases, it reduces the amount of CO₂ that can be
emitted before exceeding these temperature limits.
Conclusion:
The airborne fraction is a vital measure of the effectiveness
of Earth’s natural carbon sinks in absorbing the CO₂ the humans emit. As this fraction
increases, it signals that more of our emissions are staying in the atmosphere,
contributing to the intensification of climate change. Monitoring and reducing
the airborne fraction by enhancing carbon sinks and adopting mitigation
strategies is crucial for limiting global warming and stabilizing the climate.
(source: ChatGPT)
|
|
|
- CO2 emissions absorbed by the land and oceanic sinks. Ocean and land sinks refer to natural processes by which the Earth's oceans and terrestrial ecosystems (such as forests, soils, and wetlands) absorb and store carbon dioxide (CO2) from the atmosphere. These carbon sinks are crucial in regulating the Earth's climate, as they help mitigate the impact of human CO2 emissions, preventing even higher levels of atmospheric CO2 that would otherwise accelerate climate change. (source: ChatGPT)
- Calcuated: total net CO2 - CO2 to atmosphere
|
|
Additional Information |
|
1. Ocean Sinks:
Oceans are one of the largest carbon sinks on Earth, absorbing approximately
25-30% of human-made CO₂ emissions each year.
How the Ocean Absorbs CO₂:
- Physical Pump (Solubility Pump):
- CO₂ dissolves directly into the surface waters of the ocean. As cold water
absorbs CO₂ more efficiently, regions like the polar seas are critical for this
process.
- Once dissolved in the surface ocean, the CO₂ is transported by ocean currents to
deeper layers. This deep ocean storage can last for centuries to millennia,
sequestering CO₂ from the atmosphere for long periods.
- Biological Pump:
- Phytoplankton, tiny plant-like organisms in the ocean, absorb CO₂ from the water
for photosynthesis. When these organisms die, they sink to the ocean floor,
effectively transferring the carbon to deep ocean waters where it can remain for
long periods.
- This process plays a key role in transferring carbon from the surface ocean to
the deep ocean, where it can be sequestered.
- Coastal and Marine Ecosystems:
- Blue Carbon: Coastal ecosystems like mangroves,
salt marshes, and seagrasses are highly
efficient at storing carbon. These areas absorb CO₂ from the atmosphere and
store it in plant biomass and sediment. These ecosystems are especially
important in carbon sequestration due to their high productivity and ability to
trap carbon in waterlogged, low-oxygen conditions that prevent decomposition.
- Coral Reefs: While coral reefs themselves are not large carbon
sinks, they provide a habitat for marine life that plays a role in the marine
carbon cycle.
Challenges and Limitations:
- Ocean Acidification: Increased CO₂ levels in the atmosphere
lead to higher concentrations of dissolved CO₂ in the ocean, which lowers the
ocean’s pH and leads to ocean acidification. This can affect
marine life, particularly organisms that rely on calcium carbonate (like corals
and shellfish), and may reduce the ocean’s ability to absorb more CO₂ over time.
- Reduced Absorption Capacity: Warming of the oceans is slowing
down the carbon absorption capacity. Warmer waters are less efficient at
dissolving CO₂, meaning that as the ocean warms, it may absorb less carbon.
- Overfishing and Ecosystem Damage: Human activity, including
overfishing and habitat destruction, can damage key oceanic ecosystems (like
coral reefs and mangroves), reducing their ability to sequester carbon.
2. Land Sinks:
Land-based carbon sinks include forests, grasslands, soils, and wetlands. These
systems absorb and store significant amounts of carbon through natural processes
like photosynthesis, soil organic matter formation, and plant growth.
How Land Sinks Absorb CO₂:
-
Forests:
- Photosynthesis: Trees and other vegetation absorb CO₂ during
photosynthesis, using it to grow and form biomass (e.g., leaves, branches,
trunks).
- Forests act as large carbon sinks because they cover vast areas of land and have
high carbon-storing capacity, especially in temperate and tropical regions.
- Soil Carbon: Forests also store carbon in the soil, in the form
of decomposed organic matter like dead plants and animals. Soils can hold carbon
for hundreds to thousands of years.
-
Soils:
- Soils are a crucial terrestrial carbon sink, storing more carbon than the
atmosphere and plants combined. Carbon is stored in soil as organic matter,
which results from decaying plants and animals.
- Soil Carbon Sequestration: Sustainable land management
practices, such as no-till farming, cover cropping, and agroforestry, can
enhance the ability of soils to capture and retain carbon.
-
Wetlands:
- Wetlands, including peatlands, mangroves, and marshes, are highly effective at
storing carbon. Waterlogged conditions slow down decomposition, which allows
carbon to accumulate in the form of peat or other organic matter.
- Wetlands are considered blue carbon ecosystems when located
along coastlines (e.g., mangroves, salt marshes).
-
Grasslands and Savannahs:
- Grasslands also sequester carbon through plant growth and soil storage. While
not as significant as forests, they still play an important role in the global
carbon cycle.
Challenges and Limitations:
- Deforestation and Land-Use Change: Deforestation, land clearing
for agriculture, and urbanization release stored carbon back into the
atmosphere. When forests are removed, not only is their carbon storage capacity
lost, but the carbon they have stored in their biomass and soil is often
released.
- Soil Degradation: Practices such as intensive farming,
overgrazing, and deforestation degrade the soil, reducing its carbon storage
potential. Soil erosion and loss of organic matter can decrease its ability to
sequester carbon.
- Climate Change Impacts: Changes in temperature and
precipitation patterns due to climate change can affect the carbon sequestration
capacity of land ecosystems. For example, droughts, fires, and pests can reduce
the carbon storage potential of forests and soils. In some cases, warming soils
may release more CO₂ (a process known as soil respiration),
counteracting the carbon storage benefits.
- Forest Fires: Increased frequency and intensity of forest fires
due to climate change lead to carbon emissions. Forest fires release large
amounts of CO₂ stored in trees and soil into the atmosphere, contributing to a
feedback loop that accelerates warming.
Significance of Ocean and Land Sinks:
- Climate Mitigation: Ocean and land sinks play a key role in
mitigating climate change by absorbing about half of human-made CO₂ emissions
each year. Protecting and enhancing these natural sinks is a critical strategy
for combating global warming.
- Carbon Neutrality and Negative Emissions: Effective use of
carbon sinks is essential for achieving carbon neutrality
(balancing CO₂ emissions with carbon removals) and potentially reaching
negative emissions (removing more CO₂ from the atmosphere than is
emitted).
Future Outlook and Management:
- Enhancing Sinks: Strategies like afforestation, reforestation,
and improved land management (such as agroforestry and sustainable agriculture)
can increase carbon sequestration in land ecosystems. Additionally, restoring
damaged coastal ecosystems like mangroves and salt marshes can enhance blue
carbon storage in oceans.
- Protection of Sinks: Protecting existing forests, wetlands, and
other ecosystems from degradation is equally crucial. This includes enforcing
policies to reduce deforestation, prevent land-use change, and protect marine
ecosystems from damage.
- Carbon Capture and Storage (CCS): While not strictly a "natural
sink," CCS technologies are being developed to artificially capture and store
carbon from the atmosphere or industrial sources, potentially augmenting both
ocean and land-based carbon sequestration efforts.
Conclusion:
Ocean and land sinks are vital in helping to moderate the impacts of climate
change by absorbing and storing large amounts of CO₂ from the atmosphere.
Protecting and enhancing the capacity of these sinks is essential to any climate
strategy aimed at limiting global warming. However, their effectiveness is
limited by factors like land-use change, ocean acidification, and the impacts of
climate change on ecosystems. (source: ChatGPT)
|
|
|
- CO2 emissions added to the atmosphere
- Calculated: based on year, atmospjeric PPM and emissions (details to be added later)
|
|
Additional Information |
Formula for CO2 Emissions to the Atmosphere
Deriving a formula that relates the CO2 that ends up in the atmosphere to net CO2 emissions
- 1. Used En-ROADs to create three scenarios and copied the Net CO2 Emissions and CO2 PPM data to
a spreadsheet
- 2. The first scenario was for a 1.4°C temperature increase: https://en-roads.climateinteractive.org/scenario.html?v=24.11.0&p1=100&p7=85&p10=5&p16=-0.05&p23=25&p30=-0.07&p35=2&p39=0&p47=5&p50=5&p373=50&p375=50&p63=9&p235=0.5&p60=96&p417=100&p61=100&p67=100
- 3. This scenario was modified slightly to produce two additional scenarios - one with a 1.6°C increase and another with a 1.8°C increase
- 4. The "CO2 Added to Atmosphere" was calculated and graphed as "CO2 to Atmosphere vs CO2 Emissions"
- 5. A "subset" of this data was then used to create a polynomial function that reasonably approximated this graph (see "Coefficients for polynomial function" below)
The formula is: CO2 added to the atmosphere = 0.009993255 * Net CO2 Emissions * Net CO2 Emissions + 0.252616086 * Net CO2 Emissions - 10.6147928
Click here to download a spreadsheet with the data used to create the formula
|
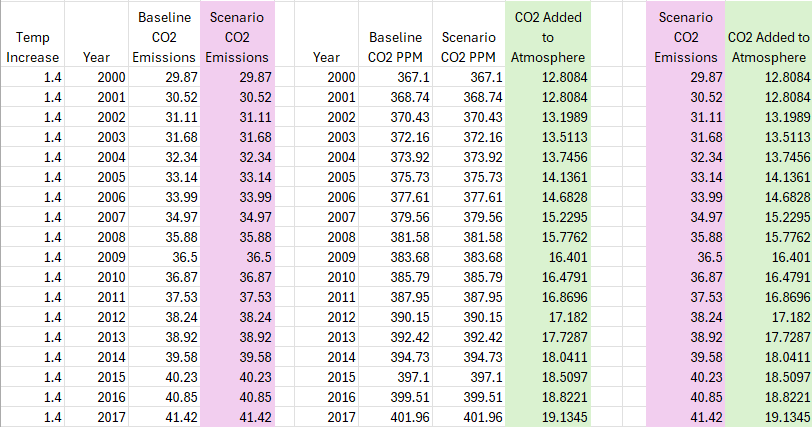 |
|
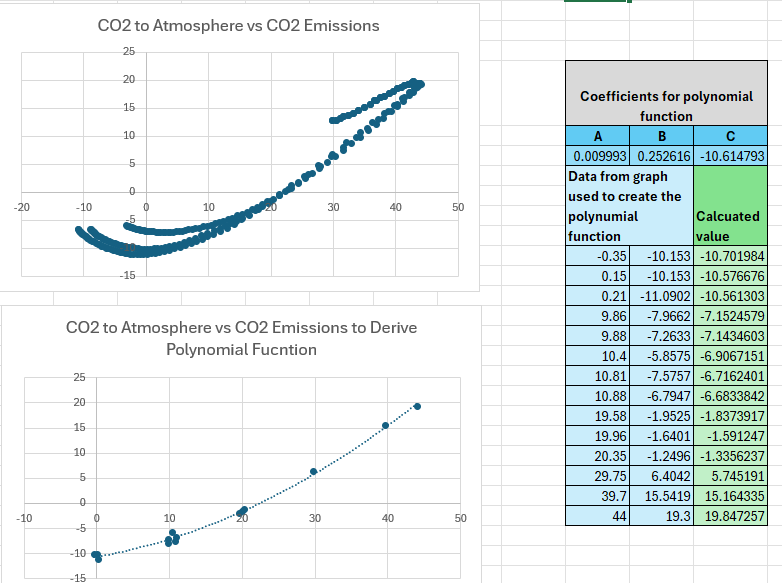 |
|
|
|
- The amount of CO2 added to the atmosphere in 'parts per million' (PPM)
- Calculated: CO2 To Atmosph/7.81
|
|
- The atmospheric concentration of CO2 from the origonal scenrio
- From the original scenario
|
|
- The atmospheric concentration of CO2
- Calculated: Previous years's PPM +PPM Added to the atmosphere
| This graph compares the projected value (heavy black line) to the range of values from some of the SSPs. | |
|---|
|
| |
|
|
|
| CH4 | W/m-2 | |
|
|
|
|
|
|
|
|
|
|
|
|
|
|
|
|
|
|
- The radiative forcing of CH4 (methane). Methane (CH4) is a potent greenhouse gas and the primary component of natural gas. It is colorless, odorless, and highly flammable. While methane is less abundant than carbon dioxide (CO2) in the atmosphere, it has a much higher global warming potential (GWP) over a short time frame, making it a critical factor in global climate change.(source: ChatGPT)
- User can enter values; if no values entered then values based on 'aggressiveness' of mitigation selection
| This graph compares the projected value (heavy black line) to the range of values from some of the SSPs. | | This graph compares the projected value (heavy black line) to the range of possible mitigation 'aggressivenesses'. | |
|---|
|
| |
| |
|
|
Additional Information |
Key Characteristics of Methane (CH₄):
- Chemical Formula: CH₄ consists of one carbon atom bonded to
four hydrogen atoms.
- Physical Properties: Methane is lighter than air and is the
simplest and most abundant of the alkanes (a type of hydrocarbon).
- Sources: Methane is released naturally and anthropogenically
(human-caused). Its sources include:
- Natural Sources:
- Wetlands (such as peatlands and swamps), where organic matter decays
anaerobically (without oxygen).
- Termites and other organisms involved in the decomposition of organic matter.
- Oceans and freshwater bodies, where microorganisms break down organic material
in oxygen-deprived environments.
- Anthropogenic (Human-Caused) Sources:
- Fossil fuel extraction: Methane is released during the
extraction, processing, and transportation of coal, oil, and natural gas.
- Agriculture: Livestock, especially ruminants like cattle,
produce methane during digestion through a process called enteric
fermentation. Rice paddies also emit methane due to the anaerobic
conditions in flooded fields.
- Landfills: Decomposing organic waste in landfills produces
methane.
- Wastewater treatment: Methane is released during the treatment
of wastewater, especially in anaerobic conditions.
- Biomass burning: The incomplete combustion of organic materials
can result in methane emissions.
Global Warming Potential of CH₄:
-
High Global Warming Potential (GWP): While methane is present
in much lower concentrations than CO₂, it is significantly more effective at
trapping heat in the atmosphere. Over a 20-year period, methane has a
GWP of around 84-87 times that of CO₂, and over a 100-year period, its
GWP is approximately 28-36 times that of CO₂. This means that,
molecule for molecule, methane is far more potent at warming the planet than
CO₂, especially in the short term.
-
Atmospheric Lifetime: Methane has a relatively short
atmospheric lifetime of about 12 years, compared to CO₂'s much
longer lifespan (hundreds to thousands of years). This makes reducing methane
emissions an effective way to achieve near-term climate benefits.
Environmental Impact of Methane (CH₄):
- Contribution to Climate Change:
- Methane is a significant greenhouse gas and a major contributor to
global warming. Although it stays in the atmosphere for a shorter time
than CO₂, its potency means it has a large impact on the climate system,
especially in the near term.
- Methane contributes to the formation of tropospheric ozone, a
potent greenhouse gas that further exacerbates climate change.
- Methane as a Short-Lived Climate Pollutant (SLCP):
- Methane is classified as a short-lived climate pollutant (SLCP)
because of its short atmospheric lifetime. Reducing methane emissions is
considered one of the most effective strategies for limiting near-term warming.
Mitigation of Methane Emissions:
Efforts to reduce methane emissions are critical in addressing both short-term
and long-term climate change. Key strategies include:
-
Reducing Fossil Fuel Emissions:
- Leak Detection and Repair: Preventing methane leaks during the
extraction, processing, and transportation of natural gas is crucial.
Technologies like infrared cameras and sensors can help detect methane leaks.
- Flare or Capture Methane: Instead of flaring methane (burning
it off), capturing and utilizing methane for energy (e.g., methane
recovery from landfills or wastewater treatment plants) can reduce its
environmental impact.
-
Agricultural Mitigation:
- Improving Livestock Management: Methane emissions from ruminant
animals can be reduced through dietary changes (such as feeding livestock more
efficiently) or through the use of additives that reduce methane production
during digestion.
- Rice Paddy Management: Reducing the amount of water used in
rice paddies (which reduces anaerobic conditions) and implementing better
farming practices can lower methane emissions from rice cultivation.
-
Waste Management:
- Landfill Gas Capture: Methane can be captured from landfills
through gas collection systems and used as an energy source,
thus preventing it from escaping into the atmosphere.
- Wastewater Treatment: Methane emissions from wastewater
treatment facilities can be reduced by optimizing treatment processes or
capturing the methane for energy generation.
-
Policy and Regulation:
- Governments and international organizations are increasingly adopting
regulations aimed at reducing methane emissions. This includes commitments under
agreements like the Global Methane Pledge, which aims to reduce
methane emissions by 30% by 2030 (from 2020 levels).
- The Kigali Amendment to the Montreal Protocol
also includes provisions for controlling methane emissions associated with
refrigeration and air conditioning systems.
Future Outlook:
- Increasing Focus on Methane Reduction: As the understanding of
methane's contribution to climate change grows, there is increasing emphasis on
reducing methane emissions, especially as it is one of the most cost-effective
strategies for mitigating near-term warming.
- Technology Development: New technologies are emerging to
capture methane more efficiently, both from industrial sources and in the
agricultural sector. Methane digesters, for example, can
capture methane from manure and convert it into biogas, which can then be used
for energy.
- Shifting to Renewable Energy: Reducing reliance on fossil fuels
and transitioning to renewable energy sources like wind, solar,
and hydroelectric power will help decrease methane emissions, particularly those
from the natural gas industry.
Conclusion:
Methane (CH₄) is a potent greenhouse gas that plays a significant role in global
warming, particularly in the short term. While methane emissions come from both
natural and human sources, the latter (especially fossil fuel extraction,
agriculture, and waste management) present the largest opportunities for
mitigation. Reducing methane emissions is a key strategy for addressing climate
change and limiting global warming, with significant benefits for both
short-term and long-term climate goals. Efforts to reduce methane emissions are
becoming a priority in international climate policy and industry practices.
(source: ChatGPT)
|
|
|
|
| N2O | W/m-2 | |
|
|
|
|
|
|
|
|
|
|
|
|
|
|
|
|
|
|
- The radiative forcing of N2O(in W/m-2). Nitrous oxide (N2O), commonly known as laughing gas, is a potent greenhouse gas and an ozone-depleting substance. It occurs naturally in the environment but is also significantly produced by human activities, particularly in agriculture and industrial processes. N2O is an important compound in the context of both climate change and stratospheric ozone depletion.(source: ChatGPT)
- User can enter values; if no values entered then values based on 'aggressiveness' of mitigation selection
| This graph compares the projected value (heavy black line) to the range of values from some of the SSPs. | | This graph compares the projected value (heavy black line) to the range of possible mitigation 'aggressivenesses'. | |
|---|
|
| |
| |
|
|
Additional Information |
Key Characteristics of Nitrous Oxide (N₂O):
- Chemical Formula: N₂O consists of two nitrogen atoms (N) and
one oxygen atom (O).
- Physical Properties: It is colorless, non-flammable, and has a
slightly sweet odor. N₂O is commonly used in medicine as an anesthetic and pain
reliever, and as a propellant in aerosol products.
- Sources: N₂O is emitted both from natural and anthropogenic
(human-caused) sources.
Natural Sources of N₂O:
- Soils: The largest natural source of N₂O is the
microbial processes that occur in soils, particularly in
wetlands, where microbes break down nitrogen compounds under anaerobic
(low oxygen) conditions. These microbes produce N₂O as a byproduct.
- Oceans: Oceans also contribute a smaller amount of N₂O,
primarily due to microbial processes in coastal and marine ecosystems.
- Forests and Grasslands: Natural nitrogen cycles in forests and
grasslands can produce small amounts of N₂O, mainly through soil microbes.
Anthropogenic Sources of N₂O:
Human activities are responsible for the vast majority of the N₂O emissions in
the atmosphere. The main sources include:
-
Agriculture:
- Fertilizer Use: The most significant anthropogenic source of
N₂O comes from the use of synthetic nitrogen fertilizers. When fertilizers are
applied to soil, microbes in the soil convert the nitrogen in the fertilizers
into various forms, including N₂O, through processes like nitrification
and denitrification.
- Manure Management: Livestock farming also contributes to N₂O
emissions. The decomposition of animal manure, particularly in wet conditions,
results in the production of N₂O.
-
Fossil Fuel Combustion: The burning of fossil fuels, especially
in cars and industrial processes, releases small amounts of N₂O into the
atmosphere. N₂O is produced during the combustion of fuel containing nitrogen
impurities.
-
Industrial Processes: Some industrial activities, such as the
production of nylon and nitric acid, release N₂O as a byproduct.
-
Waste Treatment: Wastewater treatment plants, particularly
those dealing with nitrogen-rich waste, can produce N₂O emissions during the
microbial treatment of the waste.
Environmental Impact of N₂O:
-
Global Warming Potential (GWP):
- N₂O is a potent greenhouse gas, with a GWP
around 298 times that of CO₂ over a 100-year period. This means
that, molecule for molecule, N₂O has a significantly higher heat-trapping
potential than CO₂.
- Although N₂O is present in the atmosphere in much smaller quantities than CO₂,
its high GWP makes it a major concern for climate change.
-
Ozone Depletion:
- N₂O is also an ozone-depleting substance. When it reaches the
stratosphere, N₂O is broken down by ultraviolet (UV) radiation, releasing
nitrogen oxides (NOₓ), which then contribute to the destruction of ozone
molecules in the stratosphere. The ozone layer protects life on Earth by
blocking harmful UV radiation.
- N₂O is considered the most significant ozone-depleting substance that is
not controlled by the Montreal Protocol, a treaty designed to phase out
ozone-depleting chemicals like CFCs.
Mitigation of N₂O Emissions:
Reducing N₂O emissions is important for both mitigating climate change and
protecting the ozone layer. Some strategies to reduce N₂O emissions include:
-
Agricultural Practices:
- Efficient Fertilizer Use: Reducing excess nitrogen fertilizer
use is one of the most effective ways to cut N₂O emissions. This can be achieved
through better fertilizer management practices, including precision farming,
which applies the right amount of fertilizer at the right time.
- Improved Manure Management: Techniques such as anaerobic
digestion, where manure is processed to produce biogas, can reduce N₂O emissions
from livestock farming.
- Cover Cropping: Planting cover crops during off-seasons can
help to absorb nitrogen in the soil, reducing the potential for N₂O emissions
when fertilizers are applied.
- Nitrification Inhibitors: Certain chemicals known as
nitrification inhibitors can be added to soils to slow down the conversion of
nitrogen to N₂O, thereby reducing emissions.
-
Reducing Industrial Emissions:
- Cleaner Industrial Technologies: Modifying industrial processes
to reduce the production of N₂O, such as in the production of nitric acid and
nylon, can help cut emissions from these sectors.
- Waste Treatment Improvements: Optimizing wastewater treatment
technologies to minimize N₂O production can reduce emissions from this source.
-
Policy and Regulation:
- Governments can implement regulations and policies that promote
sustainable agricultural practices, encourage energy efficiency,
and require emission reductions from industrial sectors. These
measures can help limit the amount of N₂O released into the atmosphere.
-
Alternative Nitrogen Fertilizers:
- Developing and using fertilizers with lower nitrogen content or
that are more efficient in the soil can help decrease N₂O
emissions. Some alternatives, such as controlled-release fertilizers,
release nutrients more gradually, reducing the potential for N₂O formation.
Conclusion:
Nitrous oxide (N₂O) is a powerful greenhouse gas and an important contributor to
both global warming and ozone depletion. While
natural sources of N₂O exist, human activities, particularly agriculture, are
the primary drivers of its emissions. Addressing N₂O emissions is crucial for
mitigating climate change and protecting the ozone layer. Strategies to reduce
emissions include better agricultural practices, improved waste management, and
cleaner industrial technologies. By targeting N₂O emissions, significant progress can be made in the efforts to address climate change and environmental
protection.
(source: ChatGPT)
|
|
|
|
| HFC | W/m-2 | |
|
|
|
|
|
|
|
|
|
|
|
|
|
|
|
|
|
|
- The radiative forcing of HFCs (in W/m-2)
- Disabled for now
|
|
Additional Information |
|
Hydrofluorocarbons (HFCs) are a group of man-made chemicals
primarily used as refrigerants, solvents, and in fire extinguishers. They are
part of the family of fluorinated gases, which also includes perfluorocarbons
(PFCs), sulfur hexafluoride (SF₆), and nitrogen trifluoride (NF₃). HFCs were
introduced as a replacement for older chemicals called
chlorofluorocarbons (CFCs) and halons, which were
harmful to the ozone layer. While HFCs do not deplete the ozone layer, they are
potent greenhouse gases that contribute significantly to global
warming.
Characteristics of HFCs:
- Chemical Structure: HFCs are compounds made up of hydrogen,
fluorine, and carbon atoms. They are typically colorless, odorless, and
non-flammable.
- Common Uses: HFCs are used in a variety of applications,
including:
- Refrigeration and air conditioning: HFCs are widely used as
refrigerants in both domestic and commercial cooling systems.
- Fire extinguishing systems: HFC-227ea and HFC-236fa are used in
clean agent fire suppression systems.
- Aerosols: Some HFCs are used as propellants in aerosol sprays.
- Solvents: HFCs can also serve as solvents in certain industrial
processes.
Environmental Impact:
- Global Warming Potential (GWP): HFCs have a very high GWP,
which means they are much more effective at trapping heat in the atmosphere
compared to carbon dioxide (CO₂). The GWP of HFCs varies depending on the
specific compound, but it can be hundreds to thousands of times greater than
CO₂. For instance:
- HFC-134a (commonly used in refrigeration) has a GWP of 1,430,
meaning it is 1,430 times more potent at trapping heat in the atmosphere than
CO₂ over a 100-year period.
- HFC-23, a by-product of some refrigerant manufacturing
processes, has an extremely high GWP of 14,800.
- Long Atmospheric Lifespan: HFCs can remain in the atmosphere
for many years, depending on the compound. Their long atmospheric lifetime
further amplifies their warming potential.
Regulatory Efforts and Phase-Out:
Despite their environmental drawbacks, HFCs were originally seen as a safer
alternative to CFCs and halons, which were responsible for the depletion of the
ozone layer. However, due to their contribution to global warming,
there has been increasing international pressure to reduce their use.
-
The Kigali Amendment to the Montreal Protocol (2016):
- In 2016, an amendment to the Montreal Protocol (an
international treaty aimed at phasing out substances that deplete the ozone
layer) was adopted to include the phase-out of HFCs. This was a major step in
addressing the growing impact of HFCs on climate change.
- The Kigali Amendment aims to gradually reduce the global
consumption and production of HFCs, with a goal to cut their use by more than
80% by the mid-21st century (2050).
- The amendment divides countries into groups with different timelines and targets
for phasing out HFCs. Developed countries are expected to begin reducing their
HFC usage earlier than developing countries.
-
The European Union's F-Gas Regulation:
- The EU has implemented its own regulations to reduce the use of F-gases,
including HFCs, through measures like bans on certain high-GWP HFCs in new
equipment, leak checks, and the use of alternatives with lower environmental
impact.
-
Alternatives to HFCs:
- As part of the effort to reduce the use of HFCs, many industries are
transitioning to alternative refrigerants with lower GWP. These include
hydrofluoroolefins (HFOs), ammonia (NH₃), and
carbon dioxide (CO₂).
- HFOs are a newer class of chemicals that offer a low-GWP
alternative to HFCs. For example, HFO-1234yf is increasingly
used as a refrigerant in automotive air conditioning systems because it has a
significantly lower GWP than HFC-134a.
HFCs and Climate Change:
- Contribution to Global Warming: While HFCs are not as abundant
as CO₂, they are much more potent as greenhouse gases. The rapid growth in the
use of HFCs, especially in emerging economies, has raised concerns about their
contribution to climate change. The phase-out of HFCs is an important step in
reducing the rate of global warming.
- Short-Term vs. Long-Term Impact: Even though the focus on HFCs
may seem secondary compared to CO₂, their high GWP means that their reduction
can have a significant short-term impact on mitigating climate change. Immediate
reductions in HFC emissions could help slow the rate of warming in the coming
decades, complementing efforts to reduce CO₂ emissions.
Conclusion:
HFCs, while not ozone-depleting, are potent greenhouse gases that contribute
significantly to global warming. Efforts to phase them out, such as the
Kigali Amendment to the Montreal Protocol, are
essential to mitigating climate change. Reducing HFC emissions and transitioning
to low-GWP alternatives, like HFOs, ammonia, and CO₂, are key strategies to
decrease their environmental impact and move towards a more sustainable future.
(source: ChatGPT)
|
|
|
|
| CFC | W/m-2 | |
|
|
|
|
|
|
|
|
|
|
|
|
|
|
|
|
|
|
- The radiative forcing of CFCs (in W/m-2)Chlorofluorocarbons (CFCs) are a group of man-made compounds that contain chlorine, fluorine, and carbon atoms. They were once commonly used as refrigerants, solvents, propellants in aerosol cans, and in the manufacturing of foam products. However, it was later discovered that CFCs have a devastating effect on the ozone layer and contribute to global warming, leading to their phase-out through international agreements.(source: ChatGPT)
- Disabled for now
|
|
Additional Information |
Key Characteristics of CFCs:
-
Chemical Structure:
- CFCs are made up of carbon (C), chlorine (Cl), and fluorine (F) atoms. The
number of chlorine and fluorine atoms varies depending on the specific CFC
compound.
- Example: CFC-12 (dichlorodifluoromethane) has the formula
CCl₂F₂.
-
Physical Properties:
- CFCs are typically colorless, odorless, and non-flammable, which made them
highly useful in various applications.
- They are relatively stable and inert at Earth's surface but break down in the
stratosphere when exposed to ultraviolet (UV) radiation.
Uses of CFCs:
CFCs were widely used because of their stability, non-flammability, and low
toxicity. Common uses included:
- Refrigeration and Air Conditioning: CFCs were commonly used as
refrigerants (e.g., CFC-12) due to their ability to absorb heat efficiently.
- Aerosols: CFCs were used as propellants in aerosol spray cans,
such as for deodorants, air fresheners, and other consumer products.
- Solvents: They were used in the electronics industry and in
cleaning solvents.
- Foam Blowing Agents: CFCs were used in the production of foam
products (like insulation and packaging materials), where they helped create a
lightweight, durable foam.
Environmental Impact of CFCs:
- Ozone Layer Depletion:
- CFCs and Ozone Depletion: The most significant environmental
problem caused by CFCs is their destruction of the ozone layer,
which protects life on Earth from harmful ultraviolet (UV) radiation.
- Once released into the atmosphere, CFCs are highly stable and can remain for
many years. They eventually make their way into the stratosphere,
where they are broken down by UV radiation, releasing chlorine atoms.
- These chlorine atoms then react with ozone (O₃) molecules, breaking them apart
into oxygen molecules (O₂) and individual oxygen atoms (O). This reaction
depletes the ozone layer, leading to the thinning of the ozone shield,
especially over polar regions (e.g., the "ozone hole" over Antarctica).
- Global Warming:
- CFCs as Greenhouse Gases: In addition to their role in ozone
depletion, CFCs are also potent greenhouse gases. Although they
are present in much smaller quantities than CO₂, CFCs have a high global
warming potential (GWP). For example, CFC-12 has a GWP
of 10,900, meaning that, over a 100-year period, one molecule
of CFC-12 traps 10,900 times more heat in the atmosphere than a molecule of CO₂.
- CFCs contribute to climate change by trapping heat in the
Earth's atmosphere, further exacerbating global warming.
Regulation and Phase-Out:
- Montreal Protocol (1987):
- The Montreal Protocol on Substances that Deplete the Ozone Layer
was adopted in 1987 as an international treaty to phase out the use of
ozone-depleting substances, including CFCs.
- The treaty set legally binding targets for reducing the production and
consumption of CFCs, and it has been ratified by virtually every country in the
world.
- The Kigali Amendment to the Montreal Protocol (2016) further
expanded the protocol's scope to include the phase-out of
hydrofluorocarbons (HFCs), which are also potent greenhouse gases.
- Alternatives to CFCs:
- In response to the harmful environmental impacts of CFCs, alternative substances
have been developed:
- Hydrofluorocarbons (HFCs): These were introduced as
replacements for CFCs, particularly in refrigeration and air conditioning. HFCs
do not deplete the ozone layer, but they are also potent greenhouse gases.
- Hydrofluoroolefins (HFOs): Newer refrigerants with lower global
warming potentials than HFCs are being adopted in an effort to address both
ozone depletion and climate change.
- Ammonia and CO₂: These natural substances are also being used
as refrigerants, particularly in industrial and commercial applications.
- Success of the Montreal Protocol:
- The Montreal Protocol is widely regarded as one of the most
successful international environmental agreements. It has led to a significant
reduction in CFC production and use, and as a result, the ozone layer is
gradually recovering.
- According to scientific reports, the ozone layer is expected to return to
pre-1980 levels by around 2050, provided that efforts to phase
out CFCs and other ozone-depleting chemicals are maintained.
Conclusion:
Chlorofluorocarbons (CFCs) were once widely used in refrigeration, air
conditioning, aerosols, and foam production, but their devastating effect on the
ozone layer and their contribution to climate change led to their phase-out
under the Montreal Protocol. The success of this treaty has
been a key factor in protecting the ozone layer and ensuring the gradual
recovery of this critical atmospheric shield. Although CFCs are no longer in
widespread use, they remain a significant issue due to their long atmospheric
lifetime and their potent greenhouse gas properties. Efforts to replace them
with safer alternatives, such as HFCs, HFOs, and natural refrigerants, are
crucial for mitigating both ozone depletion and global warming.
(source: ChatGPT)
|
|
|
|
| O3 | W/m-2 | |
|
|
|
|
|
|
|
|
|
|
|
|
|
|
|
|
|
|
- The radiative forcing of tropospheric ozone (in W/m-2).
Tropospheric ozone (O3) refers to the ozone found in the troposphere, which is the lowest layer of Earth's atmosphere (extending from the surface up to about 8 to 15 kilometers, depending on the latitude). Unlike stratospheric ozone, which is concentrated in the ozone layer and plays a crucial role in protecting life on Earth from harmful ultraviolet (UV) radiation, tropospheric ozone is a secondary pollutant, meaning it is not directly emitted but forms through complex chemical reactions in the atmosphere.(source: ChatGPT)
- Disabled for now
|
|
Additional Information |
|
Formation of Tropospheric Ozone:
Tropospheric ozone is mainly formed through the interaction of
precursors in the presence of sunlight. These precursors are:
- Nitrogen oxides (NOₓ), primarily produced by the combustion of
fossil fuels (e.g., from vehicles, power plants, and industrial activities).
- Volatile organic compounds (VOCs), which are emitted from
sources like vehicle exhaust, industrial emissions,
solvents, biomass burning, and
vegetation.
The basic chemical process for the formation of tropospheric ozone can be
summarized as follows:
- NOₓ (nitrogen oxides) and VOCs react in the
presence of sunlight, leading to the formation of ozone (O₃). This process is
driven by photochemical reactions, often referred to as photochemical
smog.
Here’s a simplified version of the reaction:
Environmental and Health Impacts of Tropospheric Ozone:
-
Climate Change:
- Tropospheric ozone is a potent greenhouse gas. It traps heat in
the atmosphere and contributes to global warming. It is considered the
third-largest contributor to anthropogenic climate change, after carbon
dioxide (CO₂) and methane (CH₄).
- Ozone in the troposphere contributes to the warming of the planet, making it a
key factor in both local air pollution and global climate change.
-
Air Quality and Health:
- Tropospheric ozone is a key component of smog, particularly in
urban areas. Elevated levels of ozone at the surface can cause a variety of
respiratory issues, especially for vulnerable populations, such
as children, the elderly, and those with preexisting lung conditions like
asthma.
- Short-term exposure to high levels of ozone can lead to irritation of
the eyes, throat, and lungs, as well
as shortness of breath, coughing, and
chest tightness. Long-term exposure can exacerbate chronic respiratory
diseases and reduce lung function.
- Ground-level ozone can also damage crops and vegetation,
affecting agriculture and food production. It interferes with photosynthesis,
reduces plant growth, and can damage leaves, leading to reduced crop yields.
-
Ozone as a Pollutant:
- While ozone in the stratosphere is beneficial, ozone at the surface
level is harmful because it is a strong oxidizing agent.
High concentrations of surface ozone are a significant component of
urban air pollution and contribute to the formation of smog.
- Ozone pollution is typically more severe during the warmer months, as sunlight
is necessary for its formation. Areas with high levels of traffic, industrial
emissions, and sunlight tend to have higher ozone concentrations.
-
Interaction with Other Pollutants:
- Tropospheric ozone interacts with other air pollutants. For
example, in the presence of VOCs and NOₓ, ozone formation can be enhanced. This
creates a positive feedback loop, where pollution causes more ozone formation,
which in turn exacerbates air quality issues.
- The combination of ozone and particulate matter can increase the harmful effects
on human health and the environment, making the management of air quality
complex.
Ozone Depletion and Tropospheric Ozone:
- While stratospheric ozone depletion (due to CFCs and other
chemicals) is well-known, there is a somewhat related process involving
tropospheric ozone. The lower levels of ozone can sometimes
influence stratospheric ozone. Changes in emissions and atmospheric
circulation can affect the amount of ozone in both layers, creating complex
interactions between ozone layers and contributing to broader
climate and environmental changes.
Mitigation and Control Measures:
-
Regulating NOₓ and VOCs:
- Reducing emissions of nitrogen oxides (NOₓ) and
volatile organic compounds (VOCs) is the primary strategy for reducing
tropospheric ozone levels. This can be achieved through:
- Vehicle emissions controls (e.g., using catalytic converters).
- Industrial emissions reductions (e.g., using scrubbers to
remove NOₓ and VOCs from exhaust).
- Improved fuel standards and clean energy
technologies that emit fewer pollutants.
-
Green Spaces and Urban Planning:
- Planting vegetation in urban areas can help absorb some of the
ozone and other pollutants. Urban planning that reduces congestion and the use
of high-polluting vehicles can help lower ozone concentrations.
-
International Agreements:
- Countries can collaborate to reduce air pollution through international
agreements, similar to those aimed at reducing greenhouse gases. Policies such
as the Clean Air Act in the United States and efforts in Europe
to reduce emissions of ozone precursors are examples of efforts
to tackle ozone pollution.
-
Monitoring and Forecasting:
- Monitoring ozone levels and forecasting high-ozone days can
help protect public health by providing early warnings for vulnerable groups,
such as people with respiratory issues. This helps reduce exposure during high
ozone days, especially in urban areas.
Conclusion:
Tropospheric ozone is a significant air pollutant and greenhouse gas,
contributing to both climate change and air quality
issues. It forms through complex reactions involving nitrogen oxides
and volatile organic compounds, primarily from human activities. While ozone
plays a beneficial role in the stratosphere, in the troposphere, it has harmful
effects on human health, agriculture, and the environment. Addressing ozone
pollution requires reducing emissions of its precursors, improving air quality
regulations, and transitioning to cleaner energy sources. By tackling
tropospheric ozone, we can mitigate its detrimental effects and improve both
environmental and human health outcomes.
(source: ChatGPT)
|
|
|
|
| Contrails | W/m-2 | |
|
|
|
|
|
|
|
|
|
|
|
|
|
|
|
|
|
|
- The radiative forcing from contrais (in W/m-2). Contrails (short for condensation trails) are visible streaks of cloud-like formations that are sometimes seen in the sky behind aircraft flying at high altitudes. They are formed when water vapor and gases in the aircraft's exhaust mix with the cooler air at high altitudes, causing the water vapor to condense and freeze into tiny ice crystals. Contrails are a form of artificial cloud, and while they may seem harmless, they can have significant impacts on the environment, particularly in relation to climate change. (source: ChatGPT)
- Disabled for now
|
|
Additional Information |
|
How Contrails Form:
Contrails form when aircraft fly through the upper atmosphere,
typically at altitudes between 8 and 12 kilometers (5 to 7.5 miles),
where the air is extremely cold, often below -40°C (-40°F).
Here's the basic process of contrail formation:
-
Exhaust Emissions: Aircraft engines burn fuel, producing
water vapor, carbon dioxide (CO₂),
nitrogen oxides (NOₓ), and other particles. The
exhaust gases are hot and contain water vapor in the form of steam.
-
Mixing with Cold Air: When the hot exhaust gases from the
engine mix with the cold ambient air at high altitudes, the
water vapor in the exhaust cools rapidly.
-
Condensation and Freezing: As the water vapor cools, it
condenses into water droplets or directly freezes into tiny
ice crystals, depending on the temperature of the surrounding
air. These tiny ice crystals form a visible trail behind the aircraft.
-
Contrail Formation: The contrail appears as a long, white
streak in the sky. The persistence and appearance of a contrail depend on
several factors, including altitude, temperature, humidity, and atmospheric
conditions. Contrails can disappear quickly or persist for hours.
Types of Contrails:
-
Short-lived Contrails: These form when the air is relatively
dry and the water vapor from the aircraft exhaust evaporates quickly. They
dissipate within a few minutes to an hour.
-
Persistent Contrails: These form when the air at high altitudes
is more humid, allowing the ice crystals to remain suspended in the atmosphere.
These contrails can persist for long periods (hours) and sometimes spread out,
contributing to cloud formation.
-
Contrail-Cirrus Clouds: In some cases, persistent contrails can
spread out into larger cirrus clouds, which are thin, wispy
clouds made of ice crystals. This can lead to the formation of artificial clouds
that can affect local weather patterns.
Environmental and Climatic Effects of Contrails:
Contrails, especially persistent ones, can have significant effects on the
environment and climate, both locally and globally:
-
Contribution to Climate Change:
- Global Warming: Contrails contribute to global warming by
enhancing the greenhouse effect. When persistent contrails
spread out into cirrus clouds, they trap heat in the atmosphere, just like
natural cirrus clouds. This increases the warming of the Earth
by reducing the amount of heat that escapes into space.
- Daytime Cooling and Nighttime Warming: The effect of contrails
on climate is complex. During the day, contrails can cause a slight
cooling effect by reflecting sunlight back into space. However, at
night, they tend to trap outgoing longwave radiation, leading
to warming. The overall effect is generally warming, especially
in regions with frequent air traffic.
-
Aerosol and Particulate Effects:
- Aircraft exhaust can also emit small particles, such as soot
and sulfates, which can act as nuclei for cloud formation. This
can enhance the formation of cirrus clouds and increase the number of cloud
condensation nuclei, which may alter cloud properties and atmospheric processes.
-
Radiative Forcing:
- The term radiative forcing refers to the influence a particular
factor has on the Earth's energy balance. Contrails contribute to
positive radiative forcing, meaning they increase the amount of energy
trapped in the atmosphere, thereby warming the planet.
- Studies have shown that the radiative forcing from contrails is
comparable to that of other greenhouse gases such as methane (CH₄)
and carbon dioxide (CO₂), although the effects are generally
more localized around areas of heavy air traffic.
-
Impact on Regional Climate:
- In regions with high air traffic, persistent contrails can contribute to a
phenomenon known as cloud cover enhancement, where artificial
clouds formed by contrails affect local weather patterns, such as temperature
and cloud formation. This could alter precipitation patterns
and regional climate conditions.
- In some cases, contrail-induced clouds can lead to a phenomenon
called contrail-induced cirrus cloud formation, which further
contributes to the warming of the Earth's atmosphere.
Mitigation and Solutions:
-
Reducing Aircraft Emissions:
- One potential way to reduce contrail formation is to lower the emissions
from aircraft engines, especially the water vapor and particulates.
Advances in cleaner fuels and more efficient engine
technologies could help reduce the amount of water vapor and
particulates emitted from aircraft engines, thereby minimizing the formation of
contrails.
-
Changing Flight Paths:
- Modifying flight paths to avoid regions where the atmospheric conditions are
conducive to contrail formation could reduce the overall amount of
contrail-related warming. This could involve flying at slightly different
altitudes or altering routes to avoid areas with high humidity.
-
Technological Innovations:
- Research into alternative fuels for aviation, such as biofuels,
may reduce the amount of water vapor produced during combustion, thereby
lessening contrail formation.
- Additionally, more efficient aircraft designs that reduce fuel
consumption and emissions can reduce the formation of contrails.
-
Geoengineering Approaches:
- Some researchers have considered geoengineering solutions to
counteract the effects of contrails, such as by using cloud seeding
or other techniques to manipulate atmospheric conditions. However, these
approaches are controversial and carry significant uncertainty and potential
risks.
Conclusion:
Contrails are a byproduct of aircraft flight that have a significant impact on
the environment and climate. While they can contribute to cooling during the
day, their overall effect is warming due to their ability to trap heat at night
and enhance the greenhouse effect. Persistent contrails can also contribute to
local cloud formation and alter weather patterns. As air traffic continues to
grow, it is essential to consider ways to mitigate the environmental impact of
contrails, including advancements in fuel technology, changes in flight
practices, and international cooperation to reduce aviation emissions.
(source: ChatGPT)
|
|
|
|
| Land Use | W/m-2 | |
|
|
|
|
|
|
|
|
|
|
|
|
|
|
|
|
|
|
- The radiative forcing of land use changes (in W/m-2).(source: ChatGPT)
- Disabled for now
|
|
Additional Information |
Types of Land Use Changes:
-
Agricultural Expansion:
- As populations grow and demand for food increases, large areas of forests,
grasslands, and wetlands are converted into agricultural land. This often
includes deforestation for crop production or livestock
grazing.
- The conversion of forests to agricultural land not only releases carbon stored
in trees but also reduces the land's ability to act as a carbon sink.
- Agricultural expansion is one of the largest contributors to global
deforestation, particularly in tropical regions, such as the Amazon and
Southeast Asia.
-
Urbanization:
- Urbanization involves the conversion of natural or rural areas into cities,
towns, and other human settlements. This process typically includes the
construction of infrastructure like roads, buildings, and industrial areas.
- Urbanization leads to habitat destruction, increases the demand
for resources, and contributes to higher greenhouse gas emissions
due to transportation and energy use.
- It also causes changes in local climate and disrupts ecosystems
and biodiversity.
-
Deforestation:
- Deforestation refers to the large-scale removal of forests to make way for other
land uses, including agriculture, urban development, and logging.
- Tropical deforestation is particularly concerning because these
forests are significant carbon sinks, and their removal contributes to
increased carbon emissions and a reduction in biodiversity.
- Deforestation has direct impacts on the global carbon cycle by
releasing stored carbon into the atmosphere, contributing to
climate change.
-
Reforestation and Afforestation:
- Reforestation involves replanting trees in an area where forests have been cut
down, while afforestation is the creation of new forests in previously
nonforested areas.
- Both processes can help sequester carbon from the atmosphere,
making them important tools for combating climate change.
- These activities can restore biodiversity and improve local ecosystems, but they
must be done in a way that supports the natural environment, avoiding
monoculture plantations that can harm biodiversity.
-
Wetland Drainage:
- Wetlands, such as marshes, swamps, and bogs, are often drained to make way for
agriculture, infrastructure, or urban development.
- Wetlands are vital for storing carbon and preventing flooding. When they are
drained, they release carbon that has been stored in soil for
millennia.
- Wetland loss contributes to higher greenhouse gas emissions and
decreases the ecosystem's ability to mitigate the effects of climate change.
-
Mining and Extractive Industries:
- Mining, particularly for fossil fuels, minerals, and timber, causes significant
changes in land use. The extraction process often involves large-scale
disruption of the landscape, leading to habitat loss and
soil degradation.
- Mining activities can release pollutants into the environment and contribute to
climate change by extracting and burning fossil fuels.
Drivers of Land Use Change:
-
Population Growth:
- Increasing populations lead to higher demand for food, shelter, and resources,
driving land use changes such as agricultural expansion and urbanization.
-
Economic Development:
- Industrialization and economic growth, particularly in developing countries,
often result in the conversion of land for commercial and residential purposes.
- Global trade also affects land use, especially in agricultural
production, as regions specialize in producing crops or products for export.
-
Technological Advances:
- New agricultural technologies, such as mechanized farming and genetically
modified crops, can make land more productive, leading to the expansion of
farming into previously untouched areas.
-
Government Policies:
- National and local policies, such as land subsidies, agricultural support
programs, or zoning regulations, can encourage or discourage certain types of
land use.
- Government actions in developing infrastructure, like roads and dams, can open
up previously inaccessible areas for exploitation.
-
Climate Change:
- Climate change itself can drive land use changes. For instance, regions affected
by desertification or extreme weather events may lead to shifts in agricultural
practices or urban migration.
- In some areas, changing climate conditions may make new land more suitable for
agriculture, leading to the conversion of previously unproductive or natural
lands.
Environmental Impacts of Land Use Changes:
-
Loss of Biodiversity:
- The conversion of natural habitats into agricultural or urban areas leads to the
destruction of ecosystems that are home to a wide variety of species.
- The destruction of forests, wetlands, and grasslands contributes to
species extinction and disrupts local and global ecosystems.
- Fragmentation of habitats (dividing large natural areas into smaller, isolated
sections) can also prevent species from migrating or finding suitable breeding
grounds.
-
Climate Change:
- Land use changes, especially deforestation, release large
amounts of carbon dioxide (CO₂) and other greenhouse gases into
the atmosphere. This contributes to global warming and disrupts the
carbon cycle.
- The loss of carbon sinks (forests, wetlands, and grasslands)
means that less carbon is stored, exacerbating the greenhouse effect.
-
Soil Degradation:
- The conversion of land for agriculture or urbanization can lead to soil erosion,
loss of soil fertility, and desertification.
- Overgrazing, deforestation, and poor farming practices can strip the soil of its
nutrients, reducing its ability to support plant life and agriculture.
-
Water Cycle Disruption:
- Land use changes can alter the natural water cycle by changing
evapotranspiration rates, modifying water runoff, and reducing
groundwater recharge.
- Deforestation, for example, can reduce rainfall and contribute to the drying up
of rivers and lakes.
-
Altered Hydrology:
- Urbanization, deforestation, and agricultural practices can change the natural
flow of water through the landscape, leading to increased flooding,
reduced water quality, and disturbances to aquatic ecosystems.
Mitigation and Sustainable Land Use Practices:
-
Sustainable Agriculture:
- Practices such as agroforestry, conservation tillage,
and crop rotation can help preserve soil health, reduce
erosion, and minimize the environmental impact of farming.
- Organic farming and regenerative agriculture
aim to reduce the use of synthetic chemicals and focus on building healthy soil
and maintaining biodiversity.
-
Land Restoration:
- Efforts to restore degraded lands, such as through reforestation,
afforestation, and wetland restoration, can
help reverse some of the damage caused by land use changes.
- Soil conservation techniques, such as terracing and replanting
native vegetation, can help reduce soil erosion and improve soil fertility.
-
Urban Planning:
- Sustainable urban development involves creating cities that are
energy-efficient, incorporate green spaces, and use land more effectively to
prevent sprawl and minimize habitat destruction.
- Green infrastructure such as parks, green roofs, and urban
forests can help mitigate the negative impacts of urbanization.
-
Conservation of Natural Habitats:
- Protecting natural areas from development is critical for maintaining
biodiversity and ecosystem services.
- Establishing protected areas and creating corridors
that connect fragmented habitats can help support species conservation.
-
Climate-Smart Land Use:
- Incorporating climate change considerations into land use planning helps ensure
that land use decisions are sustainable and adaptive to changing environmental
conditions.
- This includes strategies such as increased carbon sequestration,
improving water management, and reducing emissions from land use activities.
Conclusion:
Land use change is a significant driver of environmental change, with profound
impacts on biodiversity, the carbon cycle,
climate change, and local ecosystems. While land use is
essential for human development, it is important to adopt sustainable land use
practices that protect the environment and help mitigate the negative effects of
these changes. By focusing on conservation, restoration, and more sustainable
agricultural and urban planning practices, we can better balance development
with environmental protection.
(source: ChatGPT)
|
|
|
|
| Black Crb On Snow | W/m-2 | |
|
|
|
|
|
|
|
|
|
|
|
|
|
|
|
|
|
|
- The radiative forcing from black carbon on snow Black carbon on snow refers to fine particulate matter, primarily produced by the incomplete combustion of fossil fuels, biomass, and other organic materials, that settles on snow and ice surfaces. These particles, often referred to as soot, are dark in color and can significantly impact snow and ice dynamics, as well as the climate. (in W/m-2)(source: ChatGPT)
- Disabled for now
|
|
Additional Information |
|
How Black Carbon Gets on Snow:
Black carbon is emitted into the atmosphere through activities such as:
- Vehicle exhaust
- Wildfires
- Burning of fossil fuels
- Wood burning for cooking and heating
Once released into the atmosphere, black carbon particles can travel long
distances, even to remote regions such as the Arctic and
Antarctica. Wind currents can carry these particles across vast
distances before they settle onto the surface of snow and ice.
Impacts of Black Carbon on Snow:
-
Darkening of Snow and Ice:
- Black carbon is dark in color, and when it settles on snow or
ice, it reduces the snow's albedo (reflectivity). Normally,
snow reflects most of the incoming solar radiation because it is white. However,
the black carbon particles absorb more heat due to their dark color.
- As a result, the snow or ice absorbs more heat from the sun, causing it to
melt faster than it would without the soot. This process
accelerates the warming of polar regions, contributing to
climate change.
-
Accelerated Melting:
- The presence of black carbon on snow and ice leads to a positive
feedback loop. As snow melts due to increased heat absorption, it
exposes more of the underlying surface (such as land or ocean), which can absorb
even more heat, further accelerating the melting process. This leads to
faster ice loss and more rapid warming of the region.
- The faster melting of snow and ice contributes to sea level rise
and disrupts local ecosystems that depend on frozen environments.
-
Contribution to Climate Change:
- Black carbon is a potent climate forcer. Although it doesn’t stay in the
atmosphere as long as carbon dioxide (CO₂), it has a strong warming
effect while it is present. The increase in global warming
due to black carbon on snow is particularly significant in the Arctic,
where the region is already warming at a faster rate than other parts of the
world (a phenomenon known as Arctic amplification).
- The melt of Arctic ice due to black carbon can cause further
environmental and ecological changes, including the disruption of habitats for
species that rely on ice-covered regions.
-
Impact on Regional Weather Patterns:
- The darkening of snow can also influence regional weather patterns.
Reduced snow cover can alter precipitation patterns,
temperature regulation, and air currents.
These changes can have cascading effects on local climate and
ecosystems.
Mitigating the Impact of Black Carbon on Snow:
-
Reducing Black Carbon Emissions:
- Clean cooking technologies: Shifting from traditional biomass
burning to cleaner cooking stoves can reduce black carbon emissions.
- Cleaner fuels and energy sources: Reducing the use of coal,
diesel, and wood for energy production can decrease black carbon emissions. The
use of electric vehicles and renewable energy
sources can also help reduce the release of black carbon.
- Regulations and policies: Governments can implement stricter
emissions standards for industries and transportation to limit the release of
black carbon.
-
Mitigating the Effects of Black Carbon on Snow:
- Snow clearing: In some regions, efforts have been made to
clean snow or remove pollutants, including black carbon, from
snow-covered areas. However, this is often difficult to implement on a large
scale.
- Reducing wildfires: Wildfires are significant sources of black
carbon. Strategies to prevent wildfires and manage land use can reduce the
amount of soot released into the atmosphere.
-
Climate Change Mitigation:
- Tackling the larger issue of global climate change is
essential. Reducing the overall concentration of greenhouse gases in the
atmosphere, including carbon dioxide, methane, and black carbon, is crucial to
slowing the warming of the Arctic and other sensitive regions.
- International cooperation is necessary to curb emissions and
reduce the impacts of black carbon, particularly in regions where it has a
pronounced effect on snow and ice.
Conclusion:
Black carbon on snow is a significant environmental issue because it accelerates
the melting of ice and snow, especially in the Arctic and other
high-altitude regions. The darkening of snow due to black
carbon leads to more heat absorption, faster melting, and a feedback loop that
contributes to global warming. Reducing black carbon emissions,
alongside broader climate change mitigation efforts, is essential to addressing
this problem and slowing the melting of snow and ice around the world.
(source: ChatGPT)
|
|
|
|
| Other | W/m-2 | |
|
|
|
|
|
|
|
|
|
|
|
|
|
|
|
|
|
|
- The radiative forcing from all of greenhouse gases other than the ones listed above (in W/m-2)
- Disabled for now
|
|
|
| Total Other GHGs | W/m-2 | |
|
|
|
|
|
|
|
|
|
|
|
|
|
|
|
|
|
|
- The radiative forcing from all of the greenhouse gases except CO2, CH2, and N2O (in W/m-2)
- User can enter values; if no values entered then values based on 'aggressiveness' of mitigation selection
| This graph compares the projected value (heavy black line) to the range of values from some of the SSPs. | | This graph compares the projected value (heavy black line) to the range of possible mitigation 'aggressivenesses'. | |
|---|
|
| |
| |
|
|
|
| Aerosol | W/m-2 | |
|
|
|
|
|
|
|
|
|
|
|
|
|
|
|
|
|
|
- The radiative forcing from aerosols (in W/m-2). Aerosols are tiny solid or liquid particles suspended in the atmosphere. They can originate from both natural sources and human activities. Aerosols play a crucial role in the Earth's climate system and can have significant effects on air quality, weather patterns, and the global climate.(source: ChatGPT)
- User can enter values; if no values entered then values based on 'aggressiveness' of mitigation selection
| This graph compares the projected value (heavy black line) to the range of values from some of the SSPs. | | This graph compares the projected value (heavy black line) to the range of possible mitigation 'aggressivenesses'. | |
|---|
|
| |
| |
|
|
Additional Information |
Types of Aerosols:
-
Natural Aerosols:
- Sea Spray: Tiny droplets of seawater that are released into the
air when waves break on the ocean's surface. These aerosols can contribute to
cloud formation and influence the Earth's radiation balance.
- Dust: Fine particles of soil and sand, often from deserts, that
are lifted into the atmosphere by wind. Dust aerosols can affect air quality,
cloud formation, and regional climate.
- Volcanic Ash: Particles released during volcanic eruptions.
Volcanic aerosols, such as sulfur dioxide (SO₂), can remain in the atmosphere
for months or even years, affecting global temperatures and air quality.
- Biological Aerosols: Particles released by plants, fungi, and
bacteria, including pollen, spores, and microorganisms. These can affect air
quality and human health, and in some cases, influence cloud formation.
-
Anthropogenic (Human-made) Aerosols:
- Industrial Emissions: Aerosols produced by burning fossil fuels
in power plants, factories, and vehicles. These aerosols often contain
pollutants such as sulfur dioxide (SO₂), nitrogen
oxides (NOx), and black carbon (soot).
- Aerosols from Biomass Burning: Wood, crop waste, and other
organic materials are burned for heating, cooking, or land clearing. These fires
release particulate matter, including carbon-based aerosols, into the
atmosphere.
- Aerosols from Agriculture: Dust and chemicals used in
agricultural practices, such as pesticides or fertilizers, can also form
aerosols that enter the atmosphere.
- Aerosols from Urbanization: The expansion of cities can release
large amounts of aerosols from construction, transportation, and industrial
processes.
Effects of Aerosols on the Climate:
Aerosols can influence the climate in several ways, both directly
(by affecting the Earth's radiation balance) and indirectly (by
modifying cloud properties).
-
Direct Effect:
- Aerosols reflect, absorb, or scatter sunlight, which can alter the amount of
solar energy reaching the Earth's surface. For example:
- Reflecting Aerosols (such as sulfates and sea spray) can
cool the Earth's surface by reflecting sunlight back into
space. This can reduce global temperatures.
- Absorbing Aerosols (such as black carbon) can warm the
atmosphere by absorbing sunlight and radiating heat.
- The net effect of aerosols on climate depends on their composition, size, and
altitude.
-
Indirect Effect:
- Aerosols can influence cloud formation and cloud
properties. For example:
- Cloud Condensation Nuclei (CCN): Aerosols act as nuclei around
which water droplets form to create clouds. An increase in aerosols can lead to
clouds with more droplets but smaller sizes, making the clouds
more reflective and potentially cooling the Earth's surface.
- Cloud Lifetime: Aerosols can also affect the lifetime
and extent of clouds. More aerosols may lead to more persistent
clouds that could affect regional weather patterns and rainfall.
- These aerosol-induced changes in cloud properties can affect regional and global
weather, rainfall patterns, and atmospheric circulation.
Impact on Weather and Air Quality:
- Air Pollution: Aerosols can be harmful to human health. Small
particles, particularly PM2.5 (particles smaller than 2.5
micrometers), can penetrate deep into the lungs and cause respiratory and
cardiovascular diseases.
- Visibility: Aerosols in the atmosphere, especially from
industrial pollution or wildfires, can reduce visibility and
create hazy conditions. This can affect both urban and rural areas.
- Acid Rain: Some aerosols, particularly those containing sulfur
compounds, can combine with water vapor to form acid rain,
which harms ecosystems, crops, and buildings.
Aerosols and Climate Feedbacks:
Aerosols can be involved in climate feedback mechanisms. For
example:
- Amplification of Warming: As aerosols cause the melting of ice
or snow by lowering the Earth's albedo (reflectivity), the loss of ice
cover can expose darker surfaces beneath (such as ocean or land), which
absorb more heat and further accelerate warming.
- Reduced Effectiveness of Some Climate Mitigation: Aerosols like
sulfates can temporarily mask some effects of global warming, but they do not
solve the underlying problem of greenhouse gas emissions. Reducing
aerosol emissions (such as through cleaner technologies) might result
in short-term warming, even if greenhouse gases are being reduced.
Sources of Aerosols:
- Natural Sources:
- Volcanic eruptions
- Wildfires
- Dust storms
- Ocean spray (sea salt)
- Plant material and biogenic aerosols (like pollen)
- Anthropogenic (Human-caused) Sources:
- Combustion of fossil fuels (e.g., from vehicles and power plants)
- Industrial processes (e.g., cement and metal production)
- Agriculture (e.g., burning of biomass and pesticide use)
- Residential heating and cooking
Aerosols and Global Warming:
Aerosols can influence global warming by either cooling or
warming the Earth’s climate:
- Cooling Effect: Aerosols that reflect sunlight (like sulfate
aerosols) can offset some of the warming caused by greenhouse gases, but this
effect is limited and temporary.
- Warming Effect: Aerosols that absorb sunlight (like black
carbon) can warm the atmosphere and contribute to regional climate changes,
especially in sensitive areas like the Arctic.
Challenges in Climate Modeling:
The effects of aerosols on climate are complex and not yet fully understood. The
following factors make it difficult to quantify the exact impact of aerosols:
- Aerosols are highly variable in space and time.
- The way aerosols interact with clouds and sunlight is still being researched.
- Aerosols have both direct and indirect
effects, which complicates predictions.
Conclusion:
Aerosols play a significant role in both climate and air quality.
They can have both cooling and warming effects
on the Earth's climate, primarily through their interaction with sunlight and
clouds. While natural sources contribute significantly to aerosol levels, human
activities, particularly industrial emissions and fossil fuel burning, are key
contributors to aerosol pollution. Their impact on climate change is an area of
ongoing research, as understanding the complexities of aerosols is crucial for
improving climate models and addressing air quality issues.
(source: ChatGPT)
|
|
|
|
| Albedo | W/m-2 | |
|
|
|
|
|
|
|
|
|
|
|
|
|
|
|
|
|
|
- The radiative forcing from changes in the Earth's albedo (in W/m-2).
Albedo is a term used to describe the reflectivity
of a surface or body, specifically how much sunlight (solar radiation) is
reflected by that surface compared to how much is absorbed. It is expressed as a
percentage or a value between 0 and 1, where:
- Albedo of 0 means no reflection (complete absorption of
sunlight).
- Albedo of 1 means perfect reflection (no absorption of
sunlight).
In other words, a surface with high albedo reflects most of the sunlight that
hits it, while a surface with low albedo absorbs most of the sunlight. Albedo is
an important concept in climate science because it directly influences the
Earth's energy balance and temperature. (source: ChatCPG)
- User can enter values
|
|
Additional Information |
Factors Affecting Albedo:
-
Surface Type:
- Snow and Ice: Snow and ice have high albedo (typically around
0.8 to 0.9), meaning they reflect most of the sunlight. This is why regions with
ice and snow (like the polar regions) help to cool the Earth by reflecting solar
radiation.
- Water: Water has a lower albedo, especially when the sun is
directly overhead (around 0.06 for the ocean). Water absorbs much of the
sunlight that hits it, which helps warm the Earth's surface.
- Forests and Vegetation: Forested areas and vegetation have
moderate albedo, typically between 0.1 and 0.2, depending on the type of plants
and the density of the cover.
- Deserts and Sand: Sandy areas or deserts typically have higher
albedo (around 0.3 to 0.4) because the light-colored sand reflects a significant
portion of sunlight.
- Urban Areas: Cities often have a lower albedo due to asphalt,
buildings, and other materials that absorb more sunlight and heat up faster than
natural surfaces.
-
Surface Condition:
- Fresh Snow has a higher albedo compared to older, dirty snow.
As snow ages and accumulates dirt, soot, or black carbon, its albedo decreases,
leading it to absorb more heat.
- Clouds: Clouds reflect a large amount of sunlight, especially
thick clouds. The albedo of clouds can vary depending on their type, thickness,
and altitude.
-
Angle of the Sun:
- The angle at which sunlight hits a surface also affects its
albedo. When the sun is directly overhead (like at the equator), the albedo is
often lower because sunlight is more concentrated. When the sun is at a lower
angle (like at higher latitudes), the albedo is higher because sunlight is
spread over a larger area.
Albedo and Climate Change:
Albedo plays a critical role in climate regulation and can
influence the Earth's temperature in the following ways:
-
Positive Feedback Loop:
- In regions where snow and ice are abundant (such as the Arctic), the high albedo
helps reflect sunlight and cool the region. However, as temperatures rise due to
global warming, ice and snow melt, revealing darker surfaces (such as ocean
water or land) that have a lower albedo.
- This leads to more absorption of sunlight and faster
warming, creating a positive feedback loop. The more
ice and snow that melt, the more heat is absorbed by the Earth's surface, which
accelerates warming and leads to even more ice loss.
-
Global Warming:
- Reduction of Ice Cover: As the Earth's temperature increases,
particularly in the Arctic, the loss of ice decreases the
planet's overall albedo, leading to a feedback loop that accelerates warming.
This is a major factor in Arctic amplification, where the
Arctic warms at a much faster rate than other parts of the world.
- Deforestation and Land Use Changes: Changes in land use, such
as deforestation, can reduce albedo by replacing reflective forests with darker
surfaces (like urban areas or agricultural land), leading to local temperature
increases.
-
Geoengineering:
- Some geoengineering proposals aim to modify albedo to mitigate
climate change, such as by spraying reflective aerosols into the stratosphere
(to mimic the cooling effect of volcanic eruptions) or by enhancing the
albedo of surfaces like rooftops or deserts to reflect more sunlight.
Albedo and Earth’s Energy Balance:
Albedo is directly related to the Earth's energy balance. If
the Earth absorbs more energy than it reflects, it warms up. Conversely, if the
Earth reflects more energy than it absorbs, it cools down. Changes in
albedo—whether due to changes in ice cover, vegetation, or human activities—can
significantly affect this balance and thus influence global and regional
climates.
Summary:
Albedo is a measure of how much sunlight is reflected by a surface. Surfaces
like snow and ice have high albedo and help cool the planet, while surfaces like
oceans and forests have lower albedo and absorb more heat. Albedo has a profound
effect on global climate and contributes to feedback
mechanisms that can accelerate climate change. Reducing albedo in polar
regions by melting ice or increasing albedo in urban environments can
significantly influence local and global temperatures.
(source: ChatGPT)
|
|
|
- The radiative forcing of CO2 (in W/m-2)
- Calculated: log(CO2 PPM / PreIndustrial PPM) * 5.35
| This graph compares the projected value (heavy black line) to the range of values from some of the SSPs. | |
|---|
|
| |
|
|
Additional Information |
|
(source: ChatGPT)
|
|
|
- The radiative forcing of CH4 (methane). Methane (CH4) is a potent greenhouse gas and the primary component of natural gas. It is colorless, odorless, and highly flammable. While methane is less abundant than carbon dioxide (CO2) in the atmosphere, it has a much higher global warming potential (GWP) over a short time frame, making it a critical factor in global climate change.(source: ChatGPT)
- User can enter values; if no values entered then values based on 'aggressiveness' of mitigation selection
| This graph compares the projected value (heavy black line) to the range of values from some of the SSPs. | | This graph compares the projected value (heavy black line) to the range of possible mitigation 'aggressivenesses'. | |
|---|
|
| |
| |
|
|
Additional Information |
Key Characteristics of Methane (CH₄):
- Chemical Formula: CH₄ consists of one carbon atom bonded to
four hydrogen atoms.
- Physical Properties: Methane is lighter than air and is the
simplest and most abundant of the alkanes (a type of hydrocarbon).
- Sources: Methane is released naturally and anthropogenically
(human-caused). Its sources include:
- Natural Sources:
- Wetlands (such as peatlands and swamps), where organic matter decays
anaerobically (without oxygen).
- Termites and other organisms involved in the decomposition of organic matter.
- Oceans and freshwater bodies, where microorganisms break down organic material
in oxygen-deprived environments.
- Anthropogenic (Human-Caused) Sources:
- Fossil fuel extraction: Methane is released during the
extraction, processing, and transportation of coal, oil, and natural gas.
- Agriculture: Livestock, especially ruminants like cattle,
produce methane during digestion through a process called enteric
fermentation. Rice paddies also emit methane due to the anaerobic
conditions in flooded fields.
- Landfills: Decomposing organic waste in landfills produces
methane.
- Wastewater treatment: Methane is released during the treatment
of wastewater, especially in anaerobic conditions.
- Biomass burning: The incomplete combustion of organic materials
can result in methane emissions.
Global Warming Potential of CH₄:
-
High Global Warming Potential (GWP): While methane is present
in much lower concentrations than CO₂, it is significantly more effective at
trapping heat in the atmosphere. Over a 20-year period, methane has a
GWP of around 84-87 times that of CO₂, and over a 100-year period, its
GWP is approximately 28-36 times that of CO₂. This means that,
molecule for molecule, methane is far more potent at warming the planet than
CO₂, especially in the short term.
-
Atmospheric Lifetime: Methane has a relatively short
atmospheric lifetime of about 12 years, compared to CO₂'s much
longer lifespan (hundreds to thousands of years). This makes reducing methane
emissions an effective way to achieve near-term climate benefits.
Environmental Impact of Methane (CH₄):
- Contribution to Climate Change:
- Methane is a significant greenhouse gas and a major contributor to
global warming. Although it stays in the atmosphere for a shorter time
than CO₂, its potency means it has a large impact on the climate system,
especially in the near term.
- Methane contributes to the formation of tropospheric ozone, a
potent greenhouse gas that further exacerbates climate change.
- Methane as a Short-Lived Climate Pollutant (SLCP):
- Methane is classified as a short-lived climate pollutant (SLCP)
because of its short atmospheric lifetime. Reducing methane emissions is
considered one of the most effective strategies for limiting near-term warming.
Mitigation of Methane Emissions:
Efforts to reduce methane emissions are critical in addressing both short-term
and long-term climate change. Key strategies include:
-
Reducing Fossil Fuel Emissions:
- Leak Detection and Repair: Preventing methane leaks during the
extraction, processing, and transportation of natural gas is crucial.
Technologies like infrared cameras and sensors can help detect methane leaks.
- Flare or Capture Methane: Instead of flaring methane (burning
it off), capturing and utilizing methane for energy (e.g., methane
recovery from landfills or wastewater treatment plants) can reduce its
environmental impact.
-
Agricultural Mitigation:
- Improving Livestock Management: Methane emissions from ruminant
animals can be reduced through dietary changes (such as feeding livestock more
efficiently) or through the use of additives that reduce methane production
during digestion.
- Rice Paddy Management: Reducing the amount of water used in
rice paddies (which reduces anaerobic conditions) and implementing better
farming practices can lower methane emissions from rice cultivation.
-
Waste Management:
- Landfill Gas Capture: Methane can be captured from landfills
through gas collection systems and used as an energy source,
thus preventing it from escaping into the atmosphere.
- Wastewater Treatment: Methane emissions from wastewater
treatment facilities can be reduced by optimizing treatment processes or
capturing the methane for energy generation.
-
Policy and Regulation:
- Governments and international organizations are increasingly adopting
regulations aimed at reducing methane emissions. This includes commitments under
agreements like the Global Methane Pledge, which aims to reduce
methane emissions by 30% by 2030 (from 2020 levels).
- The Kigali Amendment to the Montreal Protocol
also includes provisions for controlling methane emissions associated with
refrigeration and air conditioning systems.
Future Outlook:
- Increasing Focus on Methane Reduction: As the understanding of
methane's contribution to climate change grows, there is increasing emphasis on
reducing methane emissions, especially as it is one of the most cost-effective
strategies for mitigating near-term warming.
- Technology Development: New technologies are emerging to
capture methane more efficiently, both from industrial sources and in the
agricultural sector. Methane digesters, for example, can
capture methane from manure and convert it into biogas, which can then be used
for energy.
- Shifting to Renewable Energy: Reducing reliance on fossil fuels
and transitioning to renewable energy sources like wind, solar,
and hydroelectric power will help decrease methane emissions, particularly those
from the natural gas industry.
Conclusion:
Methane (CH₄) is a potent greenhouse gas that plays a significant role in global
warming, particularly in the short term. While methane emissions come from both
natural and human sources, the latter (especially fossil fuel extraction,
agriculture, and waste management) present the largest opportunities for
mitigation. Reducing methane emissions is a key strategy for addressing climate
change and limiting global warming, with significant benefits for both
short-term and long-term climate goals. Efforts to reduce methane emissions are
becoming a priority in international climate policy and industry practices.
(source: ChatGPT)
|
|
|
- The radiative forcing of N2O(in W/m-2). Nitrous oxide (N2O), commonly known as laughing gas, is a potent greenhouse gas and an ozone-depleting substance. It occurs naturally in the environment but is also significantly produced by human activities, particularly in agriculture and industrial processes. N2O is an important compound in the context of both climate change and stratospheric ozone depletion.(source: ChatGPT)
- User can enter values; if no values entered then values based on 'aggressiveness' of mitigation selection
| This graph compares the projected value (heavy black line) to the range of values from some of the SSPs. | | This graph compares the projected value (heavy black line) to the range of possible mitigation 'aggressivenesses'. | |
|---|
|
| |
| |
|
|
Additional Information |
Key Characteristics of Nitrous Oxide (N₂O):
- Chemical Formula: N₂O consists of two nitrogen atoms (N) and
one oxygen atom (O).
- Physical Properties: It is colorless, non-flammable, and has a
slightly sweet odor. N₂O is commonly used in medicine as an anesthetic and pain
reliever, and as a propellant in aerosol products.
- Sources: N₂O is emitted both from natural and anthropogenic
(human-caused) sources.
Natural Sources of N₂O:
- Soils: The largest natural source of N₂O is the
microbial processes that occur in soils, particularly in
wetlands, where microbes break down nitrogen compounds under anaerobic
(low oxygen) conditions. These microbes produce N₂O as a byproduct.
- Oceans: Oceans also contribute a smaller amount of N₂O,
primarily due to microbial processes in coastal and marine ecosystems.
- Forests and Grasslands: Natural nitrogen cycles in forests and
grasslands can produce small amounts of N₂O, mainly through soil microbes.
Anthropogenic Sources of N₂O:
Human activities are responsible for the vast majority of the N₂O emissions in
the atmosphere. The main sources include:
-
Agriculture:
- Fertilizer Use: The most significant anthropogenic source of
N₂O comes from the use of synthetic nitrogen fertilizers. When fertilizers are
applied to soil, microbes in the soil convert the nitrogen in the fertilizers
into various forms, including N₂O, through processes like nitrification
and denitrification.
- Manure Management: Livestock farming also contributes to N₂O
emissions. The decomposition of animal manure, particularly in wet conditions,
results in the production of N₂O.
-
Fossil Fuel Combustion: The burning of fossil fuels, especially
in cars and industrial processes, releases small amounts of N₂O into the
atmosphere. N₂O is produced during the combustion of fuel containing nitrogen
impurities.
-
Industrial Processes: Some industrial activities, such as the
production of nylon and nitric acid, release N₂O as a byproduct.
-
Waste Treatment: Wastewater treatment plants, particularly
those dealing with nitrogen-rich waste, can produce N₂O emissions during the
microbial treatment of the waste.
Environmental Impact of N₂O:
-
Global Warming Potential (GWP):
- N₂O is a potent greenhouse gas, with a GWP
around 298 times that of CO₂ over a 100-year period. This means
that, molecule for molecule, N₂O has a significantly higher heat-trapping
potential than CO₂.
- Although N₂O is present in the atmosphere in much smaller quantities than CO₂,
its high GWP makes it a major concern for climate change.
-
Ozone Depletion:
- N₂O is also an ozone-depleting substance. When it reaches the
stratosphere, N₂O is broken down by ultraviolet (UV) radiation, releasing
nitrogen oxides (NOₓ), which then contribute to the destruction of ozone
molecules in the stratosphere. The ozone layer protects life on Earth by
blocking harmful UV radiation.
- N₂O is considered the most significant ozone-depleting substance that is
not controlled by the Montreal Protocol, a treaty designed to phase out
ozone-depleting chemicals like CFCs.
Mitigation of N₂O Emissions:
Reducing N₂O emissions is important for both mitigating climate change and
protecting the ozone layer. Some strategies to reduce N₂O emissions include:
-
Agricultural Practices:
- Efficient Fertilizer Use: Reducing excess nitrogen fertilizer
use is one of the most effective ways to cut N₂O emissions. This can be achieved
through better fertilizer management practices, including precision farming,
which applies the right amount of fertilizer at the right time.
- Improved Manure Management: Techniques such as anaerobic
digestion, where manure is processed to produce biogas, can reduce N₂O emissions
from livestock farming.
- Cover Cropping: Planting cover crops during off-seasons can
help to absorb nitrogen in the soil, reducing the potential for N₂O emissions
when fertilizers are applied.
- Nitrification Inhibitors: Certain chemicals known as
nitrification inhibitors can be added to soils to slow down the conversion of
nitrogen to N₂O, thereby reducing emissions.
-
Reducing Industrial Emissions:
- Cleaner Industrial Technologies: Modifying industrial processes
to reduce the production of N₂O, such as in the production of nitric acid and
nylon, can help cut emissions from these sectors.
- Waste Treatment Improvements: Optimizing wastewater treatment
technologies to minimize N₂O production can reduce emissions from this source.
-
Policy and Regulation:
- Governments can implement regulations and policies that promote
sustainable agricultural practices, encourage energy efficiency,
and require emission reductions from industrial sectors. These
measures can help limit the amount of N₂O released into the atmosphere.
-
Alternative Nitrogen Fertilizers:
- Developing and using fertilizers with lower nitrogen content or
that are more efficient in the soil can help decrease N₂O
emissions. Some alternatives, such as controlled-release fertilizers,
release nutrients more gradually, reducing the potential for N₂O formation.
Conclusion:
Nitrous oxide (N₂O) is a powerful greenhouse gas and an important contributor to
both global warming and ozone depletion. While
natural sources of N₂O exist, human activities, particularly agriculture, are
the primary drivers of its emissions. Addressing N₂O emissions is crucial for
mitigating climate change and protecting the ozone layer. Strategies to reduce
emissions include better agricultural practices, improved waste management, and
cleaner industrial technologies. By targeting N₂O emissions, significant progress can be made in the efforts to address climate change and environmental
protection.
(source: ChatGPT)
|
|
|
- The radiative forcing of HFCs (in W/m-2)
- Disabled for now
|
|
Additional Information |
|
Hydrofluorocarbons (HFCs) are a group of man-made chemicals
primarily used as refrigerants, solvents, and in fire extinguishers. They are
part of the family of fluorinated gases, which also includes perfluorocarbons
(PFCs), sulfur hexafluoride (SF₆), and nitrogen trifluoride (NF₃). HFCs were
introduced as a replacement for older chemicals called
chlorofluorocarbons (CFCs) and halons, which were
harmful to the ozone layer. While HFCs do not deplete the ozone layer, they are
potent greenhouse gases that contribute significantly to global
warming.
Characteristics of HFCs:
- Chemical Structure: HFCs are compounds made up of hydrogen,
fluorine, and carbon atoms. They are typically colorless, odorless, and
non-flammable.
- Common Uses: HFCs are used in a variety of applications,
including:
- Refrigeration and air conditioning: HFCs are widely used as
refrigerants in both domestic and commercial cooling systems.
- Fire extinguishing systems: HFC-227ea and HFC-236fa are used in
clean agent fire suppression systems.
- Aerosols: Some HFCs are used as propellants in aerosol sprays.
- Solvents: HFCs can also serve as solvents in certain industrial
processes.
Environmental Impact:
- Global Warming Potential (GWP): HFCs have a very high GWP,
which means they are much more effective at trapping heat in the atmosphere
compared to carbon dioxide (CO₂). The GWP of HFCs varies depending on the
specific compound, but it can be hundreds to thousands of times greater than
CO₂. For instance:
- HFC-134a (commonly used in refrigeration) has a GWP of 1,430,
meaning it is 1,430 times more potent at trapping heat in the atmosphere than
CO₂ over a 100-year period.
- HFC-23, a by-product of some refrigerant manufacturing
processes, has an extremely high GWP of 14,800.
- Long Atmospheric Lifespan: HFCs can remain in the atmosphere
for many years, depending on the compound. Their long atmospheric lifetime
further amplifies their warming potential.
Regulatory Efforts and Phase-Out:
Despite their environmental drawbacks, HFCs were originally seen as a safer
alternative to CFCs and halons, which were responsible for the depletion of the
ozone layer. However, due to their contribution to global warming,
there has been increasing international pressure to reduce their use.
-
The Kigali Amendment to the Montreal Protocol (2016):
- In 2016, an amendment to the Montreal Protocol (an
international treaty aimed at phasing out substances that deplete the ozone
layer) was adopted to include the phase-out of HFCs. This was a major step in
addressing the growing impact of HFCs on climate change.
- The Kigali Amendment aims to gradually reduce the global
consumption and production of HFCs, with a goal to cut their use by more than
80% by the mid-21st century (2050).
- The amendment divides countries into groups with different timelines and targets
for phasing out HFCs. Developed countries are expected to begin reducing their
HFC usage earlier than developing countries.
-
The European Union's F-Gas Regulation:
- The EU has implemented its own regulations to reduce the use of F-gases,
including HFCs, through measures like bans on certain high-GWP HFCs in new
equipment, leak checks, and the use of alternatives with lower environmental
impact.
-
Alternatives to HFCs:
- As part of the effort to reduce the use of HFCs, many industries are
transitioning to alternative refrigerants with lower GWP. These include
hydrofluoroolefins (HFOs), ammonia (NH₃), and
carbon dioxide (CO₂).
- HFOs are a newer class of chemicals that offer a low-GWP
alternative to HFCs. For example, HFO-1234yf is increasingly
used as a refrigerant in automotive air conditioning systems because it has a
significantly lower GWP than HFC-134a.
HFCs and Climate Change:
- Contribution to Global Warming: While HFCs are not as abundant
as CO₂, they are much more potent as greenhouse gases. The rapid growth in the
use of HFCs, especially in emerging economies, has raised concerns about their
contribution to climate change. The phase-out of HFCs is an important step in
reducing the rate of global warming.
- Short-Term vs. Long-Term Impact: Even though the focus on HFCs
may seem secondary compared to CO₂, their high GWP means that their reduction
can have a significant short-term impact on mitigating climate change. Immediate
reductions in HFC emissions could help slow the rate of warming in the coming
decades, complementing efforts to reduce CO₂ emissions.
Conclusion:
HFCs, while not ozone-depleting, are potent greenhouse gases that contribute
significantly to global warming. Efforts to phase them out, such as the
Kigali Amendment to the Montreal Protocol, are
essential to mitigating climate change. Reducing HFC emissions and transitioning
to low-GWP alternatives, like HFOs, ammonia, and CO₂, are key strategies to
decrease their environmental impact and move towards a more sustainable future.
(source: ChatGPT)
|
|
|
- The radiative forcing of CFCs (in W/m-2)Chlorofluorocarbons (CFCs) are a group of man-made compounds that contain chlorine, fluorine, and carbon atoms. They were once commonly used as refrigerants, solvents, propellants in aerosol cans, and in the manufacturing of foam products. However, it was later discovered that CFCs have a devastating effect on the ozone layer and contribute to global warming, leading to their phase-out through international agreements.(source: ChatGPT)
- Disabled for now
|
|
Additional Information |
Key Characteristics of CFCs:
-
Chemical Structure:
- CFCs are made up of carbon (C), chlorine (Cl), and fluorine (F) atoms. The
number of chlorine and fluorine atoms varies depending on the specific CFC
compound.
- Example: CFC-12 (dichlorodifluoromethane) has the formula
CCl₂F₂.
-
Physical Properties:
- CFCs are typically colorless, odorless, and non-flammable, which made them
highly useful in various applications.
- They are relatively stable and inert at Earth's surface but break down in the
stratosphere when exposed to ultraviolet (UV) radiation.
Uses of CFCs:
CFCs were widely used because of their stability, non-flammability, and low
toxicity. Common uses included:
- Refrigeration and Air Conditioning: CFCs were commonly used as
refrigerants (e.g., CFC-12) due to their ability to absorb heat efficiently.
- Aerosols: CFCs were used as propellants in aerosol spray cans,
such as for deodorants, air fresheners, and other consumer products.
- Solvents: They were used in the electronics industry and in
cleaning solvents.
- Foam Blowing Agents: CFCs were used in the production of foam
products (like insulation and packaging materials), where they helped create a
lightweight, durable foam.
Environmental Impact of CFCs:
- Ozone Layer Depletion:
- CFCs and Ozone Depletion: The most significant environmental
problem caused by CFCs is their destruction of the ozone layer,
which protects life on Earth from harmful ultraviolet (UV) radiation.
- Once released into the atmosphere, CFCs are highly stable and can remain for
many years. They eventually make their way into the stratosphere,
where they are broken down by UV radiation, releasing chlorine atoms.
- These chlorine atoms then react with ozone (O₃) molecules, breaking them apart
into oxygen molecules (O₂) and individual oxygen atoms (O). This reaction
depletes the ozone layer, leading to the thinning of the ozone shield,
especially over polar regions (e.g., the "ozone hole" over Antarctica).
- Global Warming:
- CFCs as Greenhouse Gases: In addition to their role in ozone
depletion, CFCs are also potent greenhouse gases. Although they
are present in much smaller quantities than CO₂, CFCs have a high global
warming potential (GWP). For example, CFC-12 has a GWP
of 10,900, meaning that, over a 100-year period, one molecule
of CFC-12 traps 10,900 times more heat in the atmosphere than a molecule of CO₂.
- CFCs contribute to climate change by trapping heat in the
Earth's atmosphere, further exacerbating global warming.
Regulation and Phase-Out:
- Montreal Protocol (1987):
- The Montreal Protocol on Substances that Deplete the Ozone Layer
was adopted in 1987 as an international treaty to phase out the use of
ozone-depleting substances, including CFCs.
- The treaty set legally binding targets for reducing the production and
consumption of CFCs, and it has been ratified by virtually every country in the
world.
- The Kigali Amendment to the Montreal Protocol (2016) further
expanded the protocol's scope to include the phase-out of
hydrofluorocarbons (HFCs), which are also potent greenhouse gases.
- Alternatives to CFCs:
- In response to the harmful environmental impacts of CFCs, alternative substances
have been developed:
- Hydrofluorocarbons (HFCs): These were introduced as
replacements for CFCs, particularly in refrigeration and air conditioning. HFCs
do not deplete the ozone layer, but they are also potent greenhouse gases.
- Hydrofluoroolefins (HFOs): Newer refrigerants with lower global
warming potentials than HFCs are being adopted in an effort to address both
ozone depletion and climate change.
- Ammonia and CO₂: These natural substances are also being used
as refrigerants, particularly in industrial and commercial applications.
- Success of the Montreal Protocol:
- The Montreal Protocol is widely regarded as one of the most
successful international environmental agreements. It has led to a significant
reduction in CFC production and use, and as a result, the ozone layer is
gradually recovering.
- According to scientific reports, the ozone layer is expected to return to
pre-1980 levels by around 2050, provided that efforts to phase
out CFCs and other ozone-depleting chemicals are maintained.
Conclusion:
Chlorofluorocarbons (CFCs) were once widely used in refrigeration, air
conditioning, aerosols, and foam production, but their devastating effect on the
ozone layer and their contribution to climate change led to their phase-out
under the Montreal Protocol. The success of this treaty has
been a key factor in protecting the ozone layer and ensuring the gradual
recovery of this critical atmospheric shield. Although CFCs are no longer in
widespread use, they remain a significant issue due to their long atmospheric
lifetime and their potent greenhouse gas properties. Efforts to replace them
with safer alternatives, such as HFCs, HFOs, and natural refrigerants, are
crucial for mitigating both ozone depletion and global warming.
(source: ChatGPT)
|
|
|
- The radiative forcing of tropospheric ozone (in W/m-2).
Tropospheric ozone (O3) refers to the ozone found in the troposphere, which is the lowest layer of Earth's atmosphere (extending from the surface up to about 8 to 15 kilometers, depending on the latitude). Unlike stratospheric ozone, which is concentrated in the ozone layer and plays a crucial role in protecting life on Earth from harmful ultraviolet (UV) radiation, tropospheric ozone is a secondary pollutant, meaning it is not directly emitted but forms through complex chemical reactions in the atmosphere.(source: ChatGPT)
- Disabled for now
|
|
Additional Information |
|
Formation of Tropospheric Ozone:
Tropospheric ozone is mainly formed through the interaction of
precursors in the presence of sunlight. These precursors are:
- Nitrogen oxides (NOₓ), primarily produced by the combustion of
fossil fuels (e.g., from vehicles, power plants, and industrial activities).
- Volatile organic compounds (VOCs), which are emitted from
sources like vehicle exhaust, industrial emissions,
solvents, biomass burning, and
vegetation.
The basic chemical process for the formation of tropospheric ozone can be
summarized as follows:
- NOₓ (nitrogen oxides) and VOCs react in the
presence of sunlight, leading to the formation of ozone (O₃). This process is
driven by photochemical reactions, often referred to as photochemical
smog.
Here’s a simplified version of the reaction:
Environmental and Health Impacts of Tropospheric Ozone:
-
Climate Change:
- Tropospheric ozone is a potent greenhouse gas. It traps heat in
the atmosphere and contributes to global warming. It is considered the
third-largest contributor to anthropogenic climate change, after carbon
dioxide (CO₂) and methane (CH₄).
- Ozone in the troposphere contributes to the warming of the planet, making it a
key factor in both local air pollution and global climate change.
-
Air Quality and Health:
- Tropospheric ozone is a key component of smog, particularly in
urban areas. Elevated levels of ozone at the surface can cause a variety of
respiratory issues, especially for vulnerable populations, such
as children, the elderly, and those with preexisting lung conditions like
asthma.
- Short-term exposure to high levels of ozone can lead to irritation of
the eyes, throat, and lungs, as well
as shortness of breath, coughing, and
chest tightness. Long-term exposure can exacerbate chronic respiratory
diseases and reduce lung function.
- Ground-level ozone can also damage crops and vegetation,
affecting agriculture and food production. It interferes with photosynthesis,
reduces plant growth, and can damage leaves, leading to reduced crop yields.
-
Ozone as a Pollutant:
- While ozone in the stratosphere is beneficial, ozone at the surface
level is harmful because it is a strong oxidizing agent.
High concentrations of surface ozone are a significant component of
urban air pollution and contribute to the formation of smog.
- Ozone pollution is typically more severe during the warmer months, as sunlight
is necessary for its formation. Areas with high levels of traffic, industrial
emissions, and sunlight tend to have higher ozone concentrations.
-
Interaction with Other Pollutants:
- Tropospheric ozone interacts with other air pollutants. For
example, in the presence of VOCs and NOₓ, ozone formation can be enhanced. This
creates a positive feedback loop, where pollution causes more ozone formation,
which in turn exacerbates air quality issues.
- The combination of ozone and particulate matter can increase the harmful effects
on human health and the environment, making the management of air quality
complex.
Ozone Depletion and Tropospheric Ozone:
- While stratospheric ozone depletion (due to CFCs and other
chemicals) is well-known, there is a somewhat related process involving
tropospheric ozone. The lower levels of ozone can sometimes
influence stratospheric ozone. Changes in emissions and atmospheric
circulation can affect the amount of ozone in both layers, creating complex
interactions between ozone layers and contributing to broader
climate and environmental changes.
Mitigation and Control Measures:
-
Regulating NOₓ and VOCs:
- Reducing emissions of nitrogen oxides (NOₓ) and
volatile organic compounds (VOCs) is the primary strategy for reducing
tropospheric ozone levels. This can be achieved through:
- Vehicle emissions controls (e.g., using catalytic converters).
- Industrial emissions reductions (e.g., using scrubbers to
remove NOₓ and VOCs from exhaust).
- Improved fuel standards and clean energy
technologies that emit fewer pollutants.
-
Green Spaces and Urban Planning:
- Planting vegetation in urban areas can help absorb some of the
ozone and other pollutants. Urban planning that reduces congestion and the use
of high-polluting vehicles can help lower ozone concentrations.
-
International Agreements:
- Countries can collaborate to reduce air pollution through international
agreements, similar to those aimed at reducing greenhouse gases. Policies such
as the Clean Air Act in the United States and efforts in Europe
to reduce emissions of ozone precursors are examples of efforts
to tackle ozone pollution.
-
Monitoring and Forecasting:
- Monitoring ozone levels and forecasting high-ozone days can
help protect public health by providing early warnings for vulnerable groups,
such as people with respiratory issues. This helps reduce exposure during high
ozone days, especially in urban areas.
Conclusion:
Tropospheric ozone is a significant air pollutant and greenhouse gas,
contributing to both climate change and air quality
issues. It forms through complex reactions involving nitrogen oxides
and volatile organic compounds, primarily from human activities. While ozone
plays a beneficial role in the stratosphere, in the troposphere, it has harmful
effects on human health, agriculture, and the environment. Addressing ozone
pollution requires reducing emissions of its precursors, improving air quality
regulations, and transitioning to cleaner energy sources. By tackling
tropospheric ozone, we can mitigate its detrimental effects and improve both
environmental and human health outcomes.
(source: ChatGPT)
|
|
|
- The radiative forcing from contrais (in W/m-2). Contrails (short for condensation trails) are visible streaks of cloud-like formations that are sometimes seen in the sky behind aircraft flying at high altitudes. They are formed when water vapor and gases in the aircraft's exhaust mix with the cooler air at high altitudes, causing the water vapor to condense and freeze into tiny ice crystals. Contrails are a form of artificial cloud, and while they may seem harmless, they can have significant impacts on the environment, particularly in relation to climate change. (source: ChatGPT)
- Disabled for now
|
|
Additional Information |
|
How Contrails Form:
Contrails form when aircraft fly through the upper atmosphere,
typically at altitudes between 8 and 12 kilometers (5 to 7.5 miles),
where the air is extremely cold, often below -40°C (-40°F).
Here's the basic process of contrail formation:
-
Exhaust Emissions: Aircraft engines burn fuel, producing
water vapor, carbon dioxide (CO₂),
nitrogen oxides (NOₓ), and other particles. The
exhaust gases are hot and contain water vapor in the form of steam.
-
Mixing with Cold Air: When the hot exhaust gases from the
engine mix with the cold ambient air at high altitudes, the
water vapor in the exhaust cools rapidly.
-
Condensation and Freezing: As the water vapor cools, it
condenses into water droplets or directly freezes into tiny
ice crystals, depending on the temperature of the surrounding
air. These tiny ice crystals form a visible trail behind the aircraft.
-
Contrail Formation: The contrail appears as a long, white
streak in the sky. The persistence and appearance of a contrail depend on
several factors, including altitude, temperature, humidity, and atmospheric
conditions. Contrails can disappear quickly or persist for hours.
Types of Contrails:
-
Short-lived Contrails: These form when the air is relatively
dry and the water vapor from the aircraft exhaust evaporates quickly. They
dissipate within a few minutes to an hour.
-
Persistent Contrails: These form when the air at high altitudes
is more humid, allowing the ice crystals to remain suspended in the atmosphere.
These contrails can persist for long periods (hours) and sometimes spread out,
contributing to cloud formation.
-
Contrail-Cirrus Clouds: In some cases, persistent contrails can
spread out into larger cirrus clouds, which are thin, wispy
clouds made of ice crystals. This can lead to the formation of artificial clouds
that can affect local weather patterns.
Environmental and Climatic Effects of Contrails:
Contrails, especially persistent ones, can have significant effects on the
environment and climate, both locally and globally:
-
Contribution to Climate Change:
- Global Warming: Contrails contribute to global warming by
enhancing the greenhouse effect. When persistent contrails
spread out into cirrus clouds, they trap heat in the atmosphere, just like
natural cirrus clouds. This increases the warming of the Earth
by reducing the amount of heat that escapes into space.
- Daytime Cooling and Nighttime Warming: The effect of contrails
on climate is complex. During the day, contrails can cause a slight
cooling effect by reflecting sunlight back into space. However, at
night, they tend to trap outgoing longwave radiation, leading
to warming. The overall effect is generally warming, especially
in regions with frequent air traffic.
-
Aerosol and Particulate Effects:
- Aircraft exhaust can also emit small particles, such as soot
and sulfates, which can act as nuclei for cloud formation. This
can enhance the formation of cirrus clouds and increase the number of cloud
condensation nuclei, which may alter cloud properties and atmospheric processes.
-
Radiative Forcing:
- The term radiative forcing refers to the influence a particular
factor has on the Earth's energy balance. Contrails contribute to
positive radiative forcing, meaning they increase the amount of energy
trapped in the atmosphere, thereby warming the planet.
- Studies have shown that the radiative forcing from contrails is
comparable to that of other greenhouse gases such as methane (CH₄)
and carbon dioxide (CO₂), although the effects are generally
more localized around areas of heavy air traffic.
-
Impact on Regional Climate:
- In regions with high air traffic, persistent contrails can contribute to a
phenomenon known as cloud cover enhancement, where artificial
clouds formed by contrails affect local weather patterns, such as temperature
and cloud formation. This could alter precipitation patterns
and regional climate conditions.
- In some cases, contrail-induced clouds can lead to a phenomenon
called contrail-induced cirrus cloud formation, which further
contributes to the warming of the Earth's atmosphere.
Mitigation and Solutions:
-
Reducing Aircraft Emissions:
- One potential way to reduce contrail formation is to lower the emissions
from aircraft engines, especially the water vapor and particulates.
Advances in cleaner fuels and more efficient engine
technologies could help reduce the amount of water vapor and
particulates emitted from aircraft engines, thereby minimizing the formation of
contrails.
-
Changing Flight Paths:
- Modifying flight paths to avoid regions where the atmospheric conditions are
conducive to contrail formation could reduce the overall amount of
contrail-related warming. This could involve flying at slightly different
altitudes or altering routes to avoid areas with high humidity.
-
Technological Innovations:
- Research into alternative fuels for aviation, such as biofuels,
may reduce the amount of water vapor produced during combustion, thereby
lessening contrail formation.
- Additionally, more efficient aircraft designs that reduce fuel
consumption and emissions can reduce the formation of contrails.
-
Geoengineering Approaches:
- Some researchers have considered geoengineering solutions to
counteract the effects of contrails, such as by using cloud seeding
or other techniques to manipulate atmospheric conditions. However, these
approaches are controversial and carry significant uncertainty and potential
risks.
Conclusion:
Contrails are a byproduct of aircraft flight that have a significant impact on
the environment and climate. While they can contribute to cooling during the
day, their overall effect is warming due to their ability to trap heat at night
and enhance the greenhouse effect. Persistent contrails can also contribute to
local cloud formation and alter weather patterns. As air traffic continues to
grow, it is essential to consider ways to mitigate the environmental impact of
contrails, including advancements in fuel technology, changes in flight
practices, and international cooperation to reduce aviation emissions.
(source: ChatGPT)
|
|
|
- The radiative forcing of land use changes (in W/m-2).(source: ChatGPT)
- Disabled for now
|
|
Additional Information |
Types of Land Use Changes:
-
Agricultural Expansion:
- As populations grow and demand for food increases, large areas of forests,
grasslands, and wetlands are converted into agricultural land. This often
includes deforestation for crop production or livestock
grazing.
- The conversion of forests to agricultural land not only releases carbon stored
in trees but also reduces the land's ability to act as a carbon sink.
- Agricultural expansion is one of the largest contributors to global
deforestation, particularly in tropical regions, such as the Amazon and
Southeast Asia.
-
Urbanization:
- Urbanization involves the conversion of natural or rural areas into cities,
towns, and other human settlements. This process typically includes the
construction of infrastructure like roads, buildings, and industrial areas.
- Urbanization leads to habitat destruction, increases the demand
for resources, and contributes to higher greenhouse gas emissions
due to transportation and energy use.
- It also causes changes in local climate and disrupts ecosystems
and biodiversity.
-
Deforestation:
- Deforestation refers to the large-scale removal of forests to make way for other
land uses, including agriculture, urban development, and logging.
- Tropical deforestation is particularly concerning because these
forests are significant carbon sinks, and their removal contributes to
increased carbon emissions and a reduction in biodiversity.
- Deforestation has direct impacts on the global carbon cycle by
releasing stored carbon into the atmosphere, contributing to
climate change.
-
Reforestation and Afforestation:
- Reforestation involves replanting trees in an area where forests have been cut
down, while afforestation is the creation of new forests in previously
nonforested areas.
- Both processes can help sequester carbon from the atmosphere,
making them important tools for combating climate change.
- These activities can restore biodiversity and improve local ecosystems, but they
must be done in a way that supports the natural environment, avoiding
monoculture plantations that can harm biodiversity.
-
Wetland Drainage:
- Wetlands, such as marshes, swamps, and bogs, are often drained to make way for
agriculture, infrastructure, or urban development.
- Wetlands are vital for storing carbon and preventing flooding. When they are
drained, they release carbon that has been stored in soil for
millennia.
- Wetland loss contributes to higher greenhouse gas emissions and
decreases the ecosystem's ability to mitigate the effects of climate change.
-
Mining and Extractive Industries:
- Mining, particularly for fossil fuels, minerals, and timber, causes significant
changes in land use. The extraction process often involves large-scale
disruption of the landscape, leading to habitat loss and
soil degradation.
- Mining activities can release pollutants into the environment and contribute to
climate change by extracting and burning fossil fuels.
Drivers of Land Use Change:
-
Population Growth:
- Increasing populations lead to higher demand for food, shelter, and resources,
driving land use changes such as agricultural expansion and urbanization.
-
Economic Development:
- Industrialization and economic growth, particularly in developing countries,
often result in the conversion of land for commercial and residential purposes.
- Global trade also affects land use, especially in agricultural
production, as regions specialize in producing crops or products for export.
-
Technological Advances:
- New agricultural technologies, such as mechanized farming and genetically
modified crops, can make land more productive, leading to the expansion of
farming into previously untouched areas.
-
Government Policies:
- National and local policies, such as land subsidies, agricultural support
programs, or zoning regulations, can encourage or discourage certain types of
land use.
- Government actions in developing infrastructure, like roads and dams, can open
up previously inaccessible areas for exploitation.
-
Climate Change:
- Climate change itself can drive land use changes. For instance, regions affected
by desertification or extreme weather events may lead to shifts in agricultural
practices or urban migration.
- In some areas, changing climate conditions may make new land more suitable for
agriculture, leading to the conversion of previously unproductive or natural
lands.
Environmental Impacts of Land Use Changes:
-
Loss of Biodiversity:
- The conversion of natural habitats into agricultural or urban areas leads to the
destruction of ecosystems that are home to a wide variety of species.
- The destruction of forests, wetlands, and grasslands contributes to
species extinction and disrupts local and global ecosystems.
- Fragmentation of habitats (dividing large natural areas into smaller, isolated
sections) can also prevent species from migrating or finding suitable breeding
grounds.
-
Climate Change:
- Land use changes, especially deforestation, release large
amounts of carbon dioxide (CO₂) and other greenhouse gases into
the atmosphere. This contributes to global warming and disrupts the
carbon cycle.
- The loss of carbon sinks (forests, wetlands, and grasslands)
means that less carbon is stored, exacerbating the greenhouse effect.
-
Soil Degradation:
- The conversion of land for agriculture or urbanization can lead to soil erosion,
loss of soil fertility, and desertification.
- Overgrazing, deforestation, and poor farming practices can strip the soil of its
nutrients, reducing its ability to support plant life and agriculture.
-
Water Cycle Disruption:
- Land use changes can alter the natural water cycle by changing
evapotranspiration rates, modifying water runoff, and reducing
groundwater recharge.
- Deforestation, for example, can reduce rainfall and contribute to the drying up
of rivers and lakes.
-
Altered Hydrology:
- Urbanization, deforestation, and agricultural practices can change the natural
flow of water through the landscape, leading to increased flooding,
reduced water quality, and disturbances to aquatic ecosystems.
Mitigation and Sustainable Land Use Practices:
-
Sustainable Agriculture:
- Practices such as agroforestry, conservation tillage,
and crop rotation can help preserve soil health, reduce
erosion, and minimize the environmental impact of farming.
- Organic farming and regenerative agriculture
aim to reduce the use of synthetic chemicals and focus on building healthy soil
and maintaining biodiversity.
-
Land Restoration:
- Efforts to restore degraded lands, such as through reforestation,
afforestation, and wetland restoration, can
help reverse some of the damage caused by land use changes.
- Soil conservation techniques, such as terracing and replanting
native vegetation, can help reduce soil erosion and improve soil fertility.
-
Urban Planning:
- Sustainable urban development involves creating cities that are
energy-efficient, incorporate green spaces, and use land more effectively to
prevent sprawl and minimize habitat destruction.
- Green infrastructure such as parks, green roofs, and urban
forests can help mitigate the negative impacts of urbanization.
-
Conservation of Natural Habitats:
- Protecting natural areas from development is critical for maintaining
biodiversity and ecosystem services.
- Establishing protected areas and creating corridors
that connect fragmented habitats can help support species conservation.
-
Climate-Smart Land Use:
- Incorporating climate change considerations into land use planning helps ensure
that land use decisions are sustainable and adaptive to changing environmental
conditions.
- This includes strategies such as increased carbon sequestration,
improving water management, and reducing emissions from land use activities.
Conclusion:
Land use change is a significant driver of environmental change, with profound
impacts on biodiversity, the carbon cycle,
climate change, and local ecosystems. While land use is
essential for human development, it is important to adopt sustainable land use
practices that protect the environment and help mitigate the negative effects of
these changes. By focusing on conservation, restoration, and more sustainable
agricultural and urban planning practices, we can better balance development
with environmental protection.
(source: ChatGPT)
|
|
|
- The radiative forcing from all of greenhouse gases other than the ones listed above (in W/m-2)
- Disabled for now
|
|
- The radiative forcing from black carbon on snow Black carbon on snow refers to fine particulate matter, primarily produced by the incomplete combustion of fossil fuels, biomass, and other organic materials, that settles on snow and ice surfaces. These particles, often referred to as soot, are dark in color and can significantly impact snow and ice dynamics, as well as the climate. (in W/m-2)(source: ChatGPT)
- Disabled for now
|
|
Additional Information |
|
How Black Carbon Gets on Snow:
Black carbon is emitted into the atmosphere through activities such as:
- Vehicle exhaust
- Wildfires
- Burning of fossil fuels
- Wood burning for cooking and heating
Once released into the atmosphere, black carbon particles can travel long
distances, even to remote regions such as the Arctic and
Antarctica. Wind currents can carry these particles across vast
distances before they settle onto the surface of snow and ice.
Impacts of Black Carbon on Snow:
-
Darkening of Snow and Ice:
- Black carbon is dark in color, and when it settles on snow or
ice, it reduces the snow's albedo (reflectivity). Normally,
snow reflects most of the incoming solar radiation because it is white. However,
the black carbon particles absorb more heat due to their dark color.
- As a result, the snow or ice absorbs more heat from the sun, causing it to
melt faster than it would without the soot. This process
accelerates the warming of polar regions, contributing to
climate change.
-
Accelerated Melting:
- The presence of black carbon on snow and ice leads to a positive
feedback loop. As snow melts due to increased heat absorption, it
exposes more of the underlying surface (such as land or ocean), which can absorb
even more heat, further accelerating the melting process. This leads to
faster ice loss and more rapid warming of the region.
- The faster melting of snow and ice contributes to sea level rise
and disrupts local ecosystems that depend on frozen environments.
-
Contribution to Climate Change:
- Black carbon is a potent climate forcer. Although it doesn’t stay in the
atmosphere as long as carbon dioxide (CO₂), it has a strong warming
effect while it is present. The increase in global warming
due to black carbon on snow is particularly significant in the Arctic,
where the region is already warming at a faster rate than other parts of the
world (a phenomenon known as Arctic amplification).
- The melt of Arctic ice due to black carbon can cause further
environmental and ecological changes, including the disruption of habitats for
species that rely on ice-covered regions.
-
Impact on Regional Weather Patterns:
- The darkening of snow can also influence regional weather patterns.
Reduced snow cover can alter precipitation patterns,
temperature regulation, and air currents.
These changes can have cascading effects on local climate and
ecosystems.
Mitigating the Impact of Black Carbon on Snow:
-
Reducing Black Carbon Emissions:
- Clean cooking technologies: Shifting from traditional biomass
burning to cleaner cooking stoves can reduce black carbon emissions.
- Cleaner fuels and energy sources: Reducing the use of coal,
diesel, and wood for energy production can decrease black carbon emissions. The
use of electric vehicles and renewable energy
sources can also help reduce the release of black carbon.
- Regulations and policies: Governments can implement stricter
emissions standards for industries and transportation to limit the release of
black carbon.
-
Mitigating the Effects of Black Carbon on Snow:
- Snow clearing: In some regions, efforts have been made to
clean snow or remove pollutants, including black carbon, from
snow-covered areas. However, this is often difficult to implement on a large
scale.
- Reducing wildfires: Wildfires are significant sources of black
carbon. Strategies to prevent wildfires and manage land use can reduce the
amount of soot released into the atmosphere.
-
Climate Change Mitigation:
- Tackling the larger issue of global climate change is
essential. Reducing the overall concentration of greenhouse gases in the
atmosphere, including carbon dioxide, methane, and black carbon, is crucial to
slowing the warming of the Arctic and other sensitive regions.
- International cooperation is necessary to curb emissions and
reduce the impacts of black carbon, particularly in regions where it has a
pronounced effect on snow and ice.
Conclusion:
Black carbon on snow is a significant environmental issue because it accelerates
the melting of ice and snow, especially in the Arctic and other
high-altitude regions. The darkening of snow due to black
carbon leads to more heat absorption, faster melting, and a feedback loop that
contributes to global warming. Reducing black carbon emissions,
alongside broader climate change mitigation efforts, is essential to addressing
this problem and slowing the melting of snow and ice around the world.
(source: ChatGPT)
|
|
|
- The radiative forcing from all of the greenhouse gases except CO2, CH2, and N2O (in W/m-2)
- User can enter values; if no values entered then values based on 'aggressiveness' of mitigation selection
| This graph compares the projected value (heavy black line) to the range of values from some of the SSPs. | | This graph compares the projected value (heavy black line) to the range of possible mitigation 'aggressivenesses'. | |
|---|
|
| |
| |
|
|
- The radiative forcing of all of the greenhouse gases (in W/m-2)
- Calculated: Sum of the above RFs
|
|
- The radiative forcing from aerosols (in W/m-2). Aerosols are tiny solid or liquid particles suspended in the atmosphere. They can originate from both natural sources and human activities. Aerosols play a crucial role in the Earth's climate system and can have significant effects on air quality, weather patterns, and the global climate.(source: ChatGPT)
- User can enter values; if no values entered then values based on 'aggressiveness' of mitigation selection
| This graph compares the projected value (heavy black line) to the range of values from some of the SSPs. | | This graph compares the projected value (heavy black line) to the range of possible mitigation 'aggressivenesses'. | |
|---|
|
| |
| |
|
|
Additional Information |
Types of Aerosols:
-
Natural Aerosols:
- Sea Spray: Tiny droplets of seawater that are released into the
air when waves break on the ocean's surface. These aerosols can contribute to
cloud formation and influence the Earth's radiation balance.
- Dust: Fine particles of soil and sand, often from deserts, that
are lifted into the atmosphere by wind. Dust aerosols can affect air quality,
cloud formation, and regional climate.
- Volcanic Ash: Particles released during volcanic eruptions.
Volcanic aerosols, such as sulfur dioxide (SO₂), can remain in the atmosphere
for months or even years, affecting global temperatures and air quality.
- Biological Aerosols: Particles released by plants, fungi, and
bacteria, including pollen, spores, and microorganisms. These can affect air
quality and human health, and in some cases, influence cloud formation.
-
Anthropogenic (Human-made) Aerosols:
- Industrial Emissions: Aerosols produced by burning fossil fuels
in power plants, factories, and vehicles. These aerosols often contain
pollutants such as sulfur dioxide (SO₂), nitrogen
oxides (NOx), and black carbon (soot).
- Aerosols from Biomass Burning: Wood, crop waste, and other
organic materials are burned for heating, cooking, or land clearing. These fires
release particulate matter, including carbon-based aerosols, into the
atmosphere.
- Aerosols from Agriculture: Dust and chemicals used in
agricultural practices, such as pesticides or fertilizers, can also form
aerosols that enter the atmosphere.
- Aerosols from Urbanization: The expansion of cities can release
large amounts of aerosols from construction, transportation, and industrial
processes.
Effects of Aerosols on the Climate:
Aerosols can influence the climate in several ways, both directly
(by affecting the Earth's radiation balance) and indirectly (by
modifying cloud properties).
-
Direct Effect:
- Aerosols reflect, absorb, or scatter sunlight, which can alter the amount of
solar energy reaching the Earth's surface. For example:
- Reflecting Aerosols (such as sulfates and sea spray) can
cool the Earth's surface by reflecting sunlight back into
space. This can reduce global temperatures.
- Absorbing Aerosols (such as black carbon) can warm the
atmosphere by absorbing sunlight and radiating heat.
- The net effect of aerosols on climate depends on their composition, size, and
altitude.
-
Indirect Effect:
- Aerosols can influence cloud formation and cloud
properties. For example:
- Cloud Condensation Nuclei (CCN): Aerosols act as nuclei around
which water droplets form to create clouds. An increase in aerosols can lead to
clouds with more droplets but smaller sizes, making the clouds
more reflective and potentially cooling the Earth's surface.
- Cloud Lifetime: Aerosols can also affect the lifetime
and extent of clouds. More aerosols may lead to more persistent
clouds that could affect regional weather patterns and rainfall.
- These aerosol-induced changes in cloud properties can affect regional and global
weather, rainfall patterns, and atmospheric circulation.
Impact on Weather and Air Quality:
- Air Pollution: Aerosols can be harmful to human health. Small
particles, particularly PM2.5 (particles smaller than 2.5
micrometers), can penetrate deep into the lungs and cause respiratory and
cardiovascular diseases.
- Visibility: Aerosols in the atmosphere, especially from
industrial pollution or wildfires, can reduce visibility and
create hazy conditions. This can affect both urban and rural areas.
- Acid Rain: Some aerosols, particularly those containing sulfur
compounds, can combine with water vapor to form acid rain,
which harms ecosystems, crops, and buildings.
Aerosols and Climate Feedbacks:
Aerosols can be involved in climate feedback mechanisms. For
example:
- Amplification of Warming: As aerosols cause the melting of ice
or snow by lowering the Earth's albedo (reflectivity), the loss of ice
cover can expose darker surfaces beneath (such as ocean or land), which
absorb more heat and further accelerate warming.
- Reduced Effectiveness of Some Climate Mitigation: Aerosols like
sulfates can temporarily mask some effects of global warming, but they do not
solve the underlying problem of greenhouse gas emissions. Reducing
aerosol emissions (such as through cleaner technologies) might result
in short-term warming, even if greenhouse gases are being reduced.
Sources of Aerosols:
- Natural Sources:
- Volcanic eruptions
- Wildfires
- Dust storms
- Ocean spray (sea salt)
- Plant material and biogenic aerosols (like pollen)
- Anthropogenic (Human-caused) Sources:
- Combustion of fossil fuels (e.g., from vehicles and power plants)
- Industrial processes (e.g., cement and metal production)
- Agriculture (e.g., burning of biomass and pesticide use)
- Residential heating and cooking
Aerosols and Global Warming:
Aerosols can influence global warming by either cooling or
warming the Earth’s climate:
- Cooling Effect: Aerosols that reflect sunlight (like sulfate
aerosols) can offset some of the warming caused by greenhouse gases, but this
effect is limited and temporary.
- Warming Effect: Aerosols that absorb sunlight (like black
carbon) can warm the atmosphere and contribute to regional climate changes,
especially in sensitive areas like the Arctic.
Challenges in Climate Modeling:
The effects of aerosols on climate are complex and not yet fully understood. The
following factors make it difficult to quantify the exact impact of aerosols:
- Aerosols are highly variable in space and time.
- The way aerosols interact with clouds and sunlight is still being researched.
- Aerosols have both direct and indirect
effects, which complicates predictions.
Conclusion:
Aerosols play a significant role in both climate and air quality.
They can have both cooling and warming effects
on the Earth's climate, primarily through their interaction with sunlight and
clouds. While natural sources contribute significantly to aerosol levels, human
activities, particularly industrial emissions and fossil fuel burning, are key
contributors to aerosol pollution. Their impact on climate change is an area of
ongoing research, as understanding the complexities of aerosols is crucial for
improving climate models and addressing air quality issues.
(source: ChatGPT)
|
|
|
- The radiative forcing from changes in the Earth's albedo (in W/m-2).
Albedo is a term used to describe the reflectivity
of a surface or body, specifically how much sunlight (solar radiation) is
reflected by that surface compared to how much is absorbed. It is expressed as a
percentage or a value between 0 and 1, where:
- Albedo of 0 means no reflection (complete absorption of
sunlight).
- Albedo of 1 means perfect reflection (no absorption of
sunlight).
In other words, a surface with high albedo reflects most of the sunlight that
hits it, while a surface with low albedo absorbs most of the sunlight. Albedo is
an important concept in climate science because it directly influences the
Earth's energy balance and temperature. (source: ChatCPG)
- User can enter values
|
|
Additional Information |
Factors Affecting Albedo:
-
Surface Type:
- Snow and Ice: Snow and ice have high albedo (typically around
0.8 to 0.9), meaning they reflect most of the sunlight. This is why regions with
ice and snow (like the polar regions) help to cool the Earth by reflecting solar
radiation.
- Water: Water has a lower albedo, especially when the sun is
directly overhead (around 0.06 for the ocean). Water absorbs much of the
sunlight that hits it, which helps warm the Earth's surface.
- Forests and Vegetation: Forested areas and vegetation have
moderate albedo, typically between 0.1 and 0.2, depending on the type of plants
and the density of the cover.
- Deserts and Sand: Sandy areas or deserts typically have higher
albedo (around 0.3 to 0.4) because the light-colored sand reflects a significant
portion of sunlight.
- Urban Areas: Cities often have a lower albedo due to asphalt,
buildings, and other materials that absorb more sunlight and heat up faster than
natural surfaces.
-
Surface Condition:
- Fresh Snow has a higher albedo compared to older, dirty snow.
As snow ages and accumulates dirt, soot, or black carbon, its albedo decreases,
leading it to absorb more heat.
- Clouds: Clouds reflect a large amount of sunlight, especially
thick clouds. The albedo of clouds can vary depending on their type, thickness,
and altitude.
-
Angle of the Sun:
- The angle at which sunlight hits a surface also affects its
albedo. When the sun is directly overhead (like at the equator), the albedo is
often lower because sunlight is more concentrated. When the sun is at a lower
angle (like at higher latitudes), the albedo is higher because sunlight is
spread over a larger area.
Albedo and Climate Change:
Albedo plays a critical role in climate regulation and can
influence the Earth's temperature in the following ways:
-
Positive Feedback Loop:
- In regions where snow and ice are abundant (such as the Arctic), the high albedo
helps reflect sunlight and cool the region. However, as temperatures rise due to
global warming, ice and snow melt, revealing darker surfaces (such as ocean
water or land) that have a lower albedo.
- This leads to more absorption of sunlight and faster
warming, creating a positive feedback loop. The more
ice and snow that melt, the more heat is absorbed by the Earth's surface, which
accelerates warming and leads to even more ice loss.
-
Global Warming:
- Reduction of Ice Cover: As the Earth's temperature increases,
particularly in the Arctic, the loss of ice decreases the
planet's overall albedo, leading to a feedback loop that accelerates warming.
This is a major factor in Arctic amplification, where the
Arctic warms at a much faster rate than other parts of the world.
- Deforestation and Land Use Changes: Changes in land use, such
as deforestation, can reduce albedo by replacing reflective forests with darker
surfaces (like urban areas or agricultural land), leading to local temperature
increases.
-
Geoengineering:
- Some geoengineering proposals aim to modify albedo to mitigate
climate change, such as by spraying reflective aerosols into the stratosphere
(to mimic the cooling effect of volcanic eruptions) or by enhancing the
albedo of surfaces like rooftops or deserts to reflect more sunlight.
Albedo and Earth’s Energy Balance:
Albedo is directly related to the Earth's energy balance. If
the Earth absorbs more energy than it reflects, it warms up. Conversely, if the
Earth reflects more energy than it absorbs, it cools down. Changes in
albedo—whether due to changes in ice cover, vegetation, or human activities—can
significantly affect this balance and thus influence global and regional
climates.
Summary:
Albedo is a measure of how much sunlight is reflected by a surface. Surfaces
like snow and ice have high albedo and help cool the planet, while surfaces like
oceans and forests have lower albedo and absorb more heat. Albedo has a profound
effect on global climate and contributes to feedback
mechanisms that can accelerate climate change. Reducing albedo in polar
regions by melting ice or increasing albedo in urban environments can
significantly influence local and global temperatures.
(source: ChatGPT)
|
|
|
- The total radiative forcing (in W/m-2)
- Calculated: Sum of all the above RFs
|
|
- Total CO2 emissions (listed above but included in this list all the CO2e factors)
- Same as 'Total net CO2' emissions
|
|
- CO2-equivelent CO2e) emissions from methane (CH4)
- Calculated: 'Total net CO2' * CH4 RF/ CO2 RF
|
|
- CO2-equivelent CO2e) emissions from N2O
- Calculated: 'Total net CO2' *N2O RF/ CO2 RF
|
|
- CO2-equivelent CO2e) emissions from HFCs
- Disabled for now
|
|
- CO2-equivelent CO2e) emissions from CFCs
- Disabled for now
|
|
- CO2-equivelent CO2e) emissions from tropospheric ozone
- Disabled for now
|
|
- CO2-equivelent CO2e) emissions from contrails
- Disabled for now
|
|
- CO2-equivelent CO2e) emissions from land use changes
- Disabled for now
|
|
- CO2-equivelent CO2e) emissions from black snow on carbon
- Disabled for now
|
|
- CO2-equivelent CO2e) emissions from all of greenhouse gases other than the ones listed above
- Disabled for now
|
|
- CO2-equivelent CO2e) emissions from all of the greenhouse gases except CO2, CH2, and N2O
- Calculated: 'Total net CO2' * Total Other RF/CO2 RF
|
|
- CO2-equivelent CO2e) emissions from all of the greenhouse gases
- Disabled for now
| This graph compares the projected value (heavy black line) to other 2050 scenarios. |
|---|
| | |
|
|
|
- CO2-equivelent CO2e) emissions from aerosols
- Calculated: 'Total net CO2' * Aerosol RF/CO2 RF
|
|
- CO2-equivelent CO2e) emissions from albedo changes
- Calculated: 'Total net CO2' * Albedo RF/CO2 RF
|
|
- The total of all CO2 and CO2-equivelent CO2e) emissions
- Calculated: 'Total net CO2' * Total RF/CO2 RF
|
|
- The temperature increase for the original scenario (only displated if one was specified)
- The temperature increase for the original scearion (only displated if one was specified)
| This graph compares the projected value (heavy black line) to the range of values from some of the SSPs. | |
|---|
|
| |
|
|
- The total radiative forcing (in W/m-2)
- Calculated: Sum of all the above RFs
|
|
- The temperature increase after changes to both CO2 and Non-CO2 emissions are taken into account
- Calculated: Either 'Temp Incr Goal' or Temp Incr (based on RF) - temp change from SRM using the formula "Value for SRM (in W/m-2) * Climate Sensivity * 0.26964486;
|
|
- The temperature increase after changes to both CO2 and Non-CO2 emissions are taken into account
- Calculated: Either 'Temp Incr Goal' or Temp Incr (based on RF) - temp change from SRM using the formula "Value for SRM (in W/m-2) * Climate Sensivity * 0.26964486;
|
|
- The temperature increase based on the total radiative forcing from greenhouse gases, aerosols, albedo, etc.
- Calculated: based on year, PPM, and total RF (details to be added later)
|
|
- The temperature increase after adjusting for the CDR needed to meet the 2100 temperature goal
- Disabled for now
|
|
- The total radiative forcing (in W/m-2)
- Calculated: Sum of all the above RFs
|
|
- The temperature increase based on the total radiative forcing from greenhouse gases, aerosols, albedo, etc.
- Calculated: based on year, PPM, and total RF (details to be added later)
|
|
- An estimate of the size of the temperature spikes in 2023 and 2024 that was not due to natural variation and is not included in climate models - i.e., the permanent temperature increase that needs to be added to the temperature projections of climate models
- User can enter value
|
|
- An estimate of the size of the temperature spikes in 2023 and 2024 that was not due to natural variation and is not included in climate models - i.e., the permanent temperature increase that needs to be added to the temperature projections of climate models
- User can enter value
|
|
- The temperature increase after the 'temperature spike' is taken into account
- Temperture increase adjusted for the temperature spike
|
|
|
| Solar Rad. Mgt. | W/m-2 | |
|
|
|
|
|
|
|
|
|
|
|
|
|
|
|
|
|
|
- The amount of 'solar radiation management' either required as specified directly by the user or calculated from the temperature increase goal
- User can enter values
|
|
|
| Temp Incr (Goal) | °C | |
|
|
|
|
|
|
|
|
|
|
|
|
|
|
|
|
|
|
- The temperature increase goal (user input)
- User can enter values
|
|
- The amount of 'solar radiation management'specified for the scenario
- From original scenario
|
|
- The amount of 'solar radiation management' either required as specified directly by the user or calculated from the temperature increase goal
- User can enter values
|
|
- The total radiative forcing (in W/m-2)
- Calculated: Sum of all the above RFs
|
|
- The temperature increase after the 'solar radiation management' is taken into account
- Calculated: Either 'Temp Incr Goal' or Temp Incr (based on RF) - temp change from SRM using the formula "Value for SRM (in W/m-2) * Climate Sensivity * 0.26964486;
|
|
- An estimate of the size of the temperature spikes in 2023 and 2024 that was not due to natural variation and is not included in climate models - i.e., the permanent temperature increase that needs to be added to the temperature projections of climate models
- User can enter value
|
|
- The temperature increase after the 'temperature spike' is taken into account
- Temperture increase adjusted for the temperature spike
|
|
- The temperature increase goal (user input)
- User can enter values
|
|
Model Options - Select values on the 'Options' Tab
|
|
- Cost per ton sequestered by
- User can enter values
|
|
- Sea Level Rise Per °C
- The user can enter values.
|
|
- Annual costs of disasters
- The user can enter values. The model initializes the cost of disasters to $300 Billion in 2100 for the most aggressive mitigation scenario and to $750 Billion in 2100 for the least aggressive scenario. This needs to be adjusted.
|
|
Additional Information |
Cost of Disasters
|
The annual costs for climatological, hydrological, and meteorological natural disasters for 2000 through 2023 were obtained from
The Centre for Research on the Epidemiology of Disasters (CRED)
(https://public.emdat.be/data) (see Figure 1). Linear projections of this data though 2100 were then made (see Table 1). |
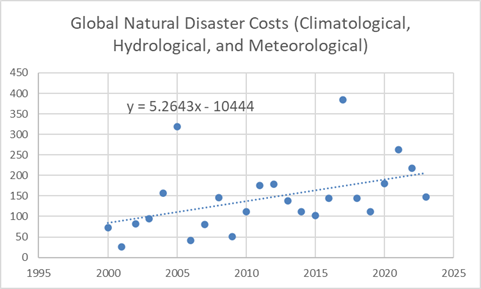 |
|
Year |
Projected Cost |
|
2025 |
216 |
|
2030 |
243 |
|
2035 |
269 |
|
2040 |
295 |
|
2045 |
321 |
|
2050 |
348 |
|
2055 |
374 |
|
2060 |
400 |
|
2065 |
427 |
|
2070 |
453 |
|
2075 |
479 |
|
2080 |
506 |
|
2085 |
532 |
|
2090 |
558 |
|
2095 |
585 |
|
2100 |
611 |
|
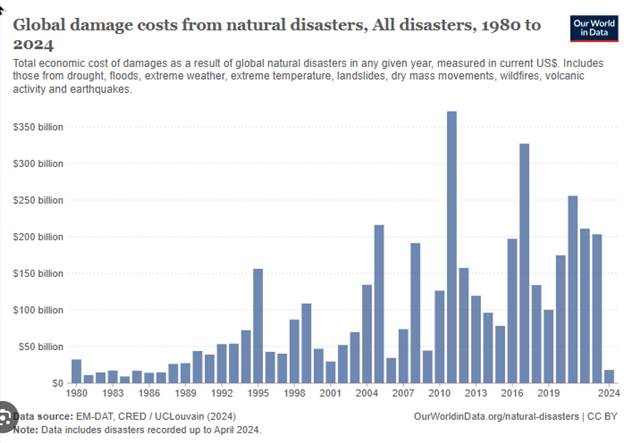 |
|
Figure 1. Scatter plot of annual natural disaster costs. |
Table 1. Linear projections of this data though 2100 |
Figure 2. Total costs of all natural disasters |
|
|
|
|
|
|
- Carbon removal refers to all human derived techniques/process that remove CO2 from the atmopshere (CCS, DAC, mineraliation, etc.)
- User can enter values
|
|
|
| Dir Air Capt (DAC) | $/Ton | |
|
|
|
|
|
|
|
|
|
|
|
|
|
|
|
|
|
|
- Cost per ton sequestered by DAC
- Disabled for now
|
|
|
| Afforestation | $/Ton | |
|
|
|
|
|
|
|
|
|
|
|
|
|
|
|
|
|
|
- Cost per ton sequestered by afforestation
- Disabled for now
|
|
|
| Mineralization | $/Ton | |
|
|
|
|
|
|
|
|
|
|
|
|
|
|
|
|
|
|
- Cost per ton sequestered by mineralization
- Disabled for now
|
|
|
| Agricult Soil Carb | $/Ton | |
|
|
|
|
|
|
|
|
|
|
|
|
|
|
|
|
|
|
- Cost per ton sequestered by agricultural soil carbon
- Disabled for now
|
|
|
| Biochar | $/Ton | |
|
|
|
|
|
|
|
|
|
|
|
|
|
|
|
|
|
|
- Cost per ton sequestered by biochar
- Disabled for now
|
|
|
| Ocenanic Removal | $/Ton | |
|
|
|
|
|
|
|
|
|
|
|
|
|
|
|
|
|
|
- Cost per ton sequestered by oceanic carbon dioxide removal (mCDR)
- Disabled for now
|
|
- Carbon removal refers to all human derived techniques/process that remove CO2 from the atmopshere (CCS, DAC, mineraliation, etc.)
- Calculated:
|
|
- Cost per ton sequestered by CCS
- Disabled for now
|
|
- Cost per ton sequestered by DAC
- Disabled for now
|
|
- Cost per ton sequestered by afforestation
- Disabled for now
|
|
- Cost per ton sequestered by mineralization
- Disabled for now
|
|
- Cost per ton sequestered by agricultural soil carbon
- Disabled for now
|
|
- Cost per ton sequestered by biochar
- Disabled for now
|
|
- Cost per ton sequestered by oceanic carbon dioxide removal (mCDR)
- Disabled for now
|
|
- Average annual cost carbon dioxide removal all CDR
- Calculated: Total Carbon Removal * Carbon Removal cost/ton
|
|
- Sea level rise
- The user can enter values.
|
|
- Annual costs of sea level rise
- The user can enter values. The model initializes the cost of disasters to $300 Billion in 2100 for the most aggressive mitigation scenario and to $750 Billion in 2100 for the least aggressive scenario. This needs to be adjusted.
|
|
- Annual cost carbon dioxide removal for DAC
|
|
- Annual cost carbon dioxide removal for CCS
- Disabled for now
|
|
- Annual cost carbon dioxide removal for DAC
- Disabled for now
|
|
- Annual cost carbon dioxide removal for afforestation
- Disabled for now
|
|
- Annual cost carbon dioxide removal for mineralization
- Disabled for now
|
|
- Annual cost carbon dioxide removal for agricultural soil carbon
- Disabled for now
|
|
- Annual cost carbon dioxide removal for biochar
- Disabled for now
|
|
- Annual cost carbon dioxide removal for oceanic carbon dioxide removal (mCDR)
- Disabled for now
|
|
- Annual costs of disasters
- The user can enter values. The model initializes the cost of disasters to $300 Billion in 2100 for the most aggressive mitigation scenario and to $750 Billion in 2100 for the least aggressive scenario. This needs to be adjusted.
|
|
Additional Information |
Cost of Disasters
|
The annual costs for climatological, hydrological, and meteorological natural disasters for 2000 through 2023 were obtained from
The Centre for Research on the Epidemiology of Disasters (CRED)
(https://public.emdat.be/data) (see Figure 1). Linear projections of this data though 2100 were then made (see Table 1). |
|
|
|
Year |
Projected Cost |
|
2025 |
216 |
|
2030 |
243 |
|
2035 |
269 |
|
2040 |
295 |
|
2045 |
321 |
|
2050 |
348 |
|
2055 |
374 |
|
2060 |
400 |
|
2065 |
427 |
|
2070 |
453 |
|
2075 |
479 |
|
2080 |
506 |
|
2085 |
532 |
|
2090 |
558 |
|
2095 |
585 |
|
2100 |
611 |
|
|
|
Figure 1. Scatter plot of annual natural disaster costs. |
Table 1. Linear projections of this data though 2100 |
Figure 2. Total costs of all natural disasters |
|
|
|
|
|
|
- Annual total costs of disasters, CDR, etc.
- User can enter values
|
|
- Climate feedbacks refer to processes that can amplify or dampen the effects of climate change. These feedbacks are mechanisms that occur as a result of the changing climate itself and either reinforce or mitigate the initial changes caused by human activities, such as the burning of fossil fuels. (source: ChatGPT)
- User can enter values
|
|
Additional Information |
|
(source: ChatGPT)
|
|
|
- Total Net CO2
- Calcuated: The sum of all CO2 emissions and removals
|
|
- The amount of CO2 added to the atmosphere in 'parts per million' (PPM)
- Calculated: CO2 To Atmosph/7.81
|
|
- The atmospheric concentration of CO2
- Calculated: Previous years's PPM +PPM Added to the atmosphere
|
|
- The radiative forcing of CO2 (in W/m-2)
- Calculated: log(CO2 PPM / PreIndustrial PPM) * 5.35
|
|
Additional Information |
|
(source: ChatGPT)
|
|
|
- The total radiative forcing (in W/m-2)
- Calculated: Sum of all the above RFs
|
|
|
|
|
Cost Curves
These are the "cost curves" that are used to calculate the expected costs associated with a pathway. With the exception of the "~En-ROADS" curves (which were derived from values from the En-ROADS global climate simulator), each cost curve name includes the 2100 value. For "Carbon Removal" the curve name starts with the 2025 value. The costs curves used in the calculations can be changed by clicking one of the "radio buttons". The current cost curves need to be revised as they are just SWAGs ("scientific wild-assed guesses"). And more costs (e.g., mitigation, GDP loss, etc.) need to be added. |
| | SLR Cost Per Foot ($B/Ft) |
|---|
| | |
| | Carbon Removal ($/Ton in 2025/2100) |
|---|
| | |
|
| Sea Level Rise Per °C of Warming (Feet in 2100) |
|---|
| | |
| | Disaster Costs Per °C of Warming ($B/Year) |
|---|
| | |
|
| | CCS, BECCS, etc ($/Ton in 2025/2100) |
|---|
| | |
|
|
|
- Anthropogenic (human caused) CO2 emissions, including those from the burning of fossil fuels, manufacturing cement, and land use changes
- User can enter values
| This graph compares the projected value (heavy black line) to the range of values from some of the SSPs. | | This graph compares the projected value (heavy black line) to other 2050 scenarios. |
|---|
|
| |
|
|
|
- Carbon removal refers to all human derived techniques/process that remove CO2 from the atmopshere (CCS, DAC, mineraliation, etc.)
- User can enter values
|
|
- CO2 Emissions captured at the source
- User can enter values
| This graph compares the projected value (heavy black line) to the range of values from some of the SSPs. | |
|---|
|
| |
|
|
- Total Anthro CO2
- Calcuated: The sum of all CO2 emissions and removals
|
|
- Climate feedbacks refer to processes that can amplify or dampen the effects of climate change. These feedbacks are mechanisms that occur as a result of the changing climate itself and either reinforce or mitigate the initial changes caused by human activities, such as the burning of fossil fuels. (source: ChatGPT)
- User can enter values
|
|
Additional Information |
|
(source: ChatGPT)
|
|
|
- Total Net CO2
- Calcuated: The sum of all CO2 emissions and removals
|
|
- The atmospheric concentration of CO2
- Calculated: Previous years's PPM +PPM Added to the atmosphere
| This graph compares the projected value (heavy black line) to the range of values from some of the SSPs. | |
|---|
|
| |
|
|
- The radiative forcing of CO2 (in W/m-2)
- Calculated: log(CO2 PPM / PreIndustrial PPM) * 5.35
| This graph compares the projected value (heavy black line) to the range of values from some of the SSPs. | |
|---|
|
| |
|
|
Additional Information |
|
(source: ChatGPT)
|
|
|
- The radiative forcing of CH4 (methane). Methane (CH4) is a potent greenhouse gas and the primary component of natural gas. It is colorless, odorless, and highly flammable. While methane is less abundant than carbon dioxide (CO2) in the atmosphere, it has a much higher global warming potential (GWP) over a short time frame, making it a critical factor in global climate change.(source: ChatGPT)
- User can enter values; if no values entered then values based on 'aggressiveness' of mitigation selection
| This graph compares the projected value (heavy black line) to the range of values from some of the SSPs. | | This graph compares the projected value (heavy black line) to the range of possible mitigation 'aggressivenesses'. | |
|---|
|
| |
| |
|
|
Additional Information |
Key Characteristics of Methane (CH₄):
- Chemical Formula: CH₄ consists of one carbon atom bonded to
four hydrogen atoms.
- Physical Properties: Methane is lighter than air and is the
simplest and most abundant of the alkanes (a type of hydrocarbon).
- Sources: Methane is released naturally and anthropogenically
(human-caused). Its sources include:
- Natural Sources:
- Wetlands (such as peatlands and swamps), where organic matter decays
anaerobically (without oxygen).
- Termites and other organisms involved in the decomposition of organic matter.
- Oceans and freshwater bodies, where microorganisms break down organic material
in oxygen-deprived environments.
- Anthropogenic (Human-Caused) Sources:
- Fossil fuel extraction: Methane is released during the
extraction, processing, and transportation of coal, oil, and natural gas.
- Agriculture: Livestock, especially ruminants like cattle,
produce methane during digestion through a process called enteric
fermentation. Rice paddies also emit methane due to the anaerobic
conditions in flooded fields.
- Landfills: Decomposing organic waste in landfills produces
methane.
- Wastewater treatment: Methane is released during the treatment
of wastewater, especially in anaerobic conditions.
- Biomass burning: The incomplete combustion of organic materials
can result in methane emissions.
Global Warming Potential of CH₄:
-
High Global Warming Potential (GWP): While methane is present
in much lower concentrations than CO₂, it is significantly more effective at
trapping heat in the atmosphere. Over a 20-year period, methane has a
GWP of around 84-87 times that of CO₂, and over a 100-year period, its
GWP is approximately 28-36 times that of CO₂. This means that,
molecule for molecule, methane is far more potent at warming the planet than
CO₂, especially in the short term.
-
Atmospheric Lifetime: Methane has a relatively short
atmospheric lifetime of about 12 years, compared to CO₂'s much
longer lifespan (hundreds to thousands of years). This makes reducing methane
emissions an effective way to achieve near-term climate benefits.
Environmental Impact of Methane (CH₄):
- Contribution to Climate Change:
- Methane is a significant greenhouse gas and a major contributor to
global warming. Although it stays in the atmosphere for a shorter time
than CO₂, its potency means it has a large impact on the climate system,
especially in the near term.
- Methane contributes to the formation of tropospheric ozone, a
potent greenhouse gas that further exacerbates climate change.
- Methane as a Short-Lived Climate Pollutant (SLCP):
- Methane is classified as a short-lived climate pollutant (SLCP)
because of its short atmospheric lifetime. Reducing methane emissions is
considered one of the most effective strategies for limiting near-term warming.
Mitigation of Methane Emissions:
Efforts to reduce methane emissions are critical in addressing both short-term
and long-term climate change. Key strategies include:
-
Reducing Fossil Fuel Emissions:
- Leak Detection and Repair: Preventing methane leaks during the
extraction, processing, and transportation of natural gas is crucial.
Technologies like infrared cameras and sensors can help detect methane leaks.
- Flare or Capture Methane: Instead of flaring methane (burning
it off), capturing and utilizing methane for energy (e.g., methane
recovery from landfills or wastewater treatment plants) can reduce its
environmental impact.
-
Agricultural Mitigation:
- Improving Livestock Management: Methane emissions from ruminant
animals can be reduced through dietary changes (such as feeding livestock more
efficiently) or through the use of additives that reduce methane production
during digestion.
- Rice Paddy Management: Reducing the amount of water used in
rice paddies (which reduces anaerobic conditions) and implementing better
farming practices can lower methane emissions from rice cultivation.
-
Waste Management:
- Landfill Gas Capture: Methane can be captured from landfills
through gas collection systems and used as an energy source,
thus preventing it from escaping into the atmosphere.
- Wastewater Treatment: Methane emissions from wastewater
treatment facilities can be reduced by optimizing treatment processes or
capturing the methane for energy generation.
-
Policy and Regulation:
- Governments and international organizations are increasingly adopting
regulations aimed at reducing methane emissions. This includes commitments under
agreements like the Global Methane Pledge, which aims to reduce
methane emissions by 30% by 2030 (from 2020 levels).
- The Kigali Amendment to the Montreal Protocol
also includes provisions for controlling methane emissions associated with
refrigeration and air conditioning systems.
Future Outlook:
- Increasing Focus on Methane Reduction: As the understanding of
methane's contribution to climate change grows, there is increasing emphasis on
reducing methane emissions, especially as it is one of the most cost-effective
strategies for mitigating near-term warming.
- Technology Development: New technologies are emerging to
capture methane more efficiently, both from industrial sources and in the
agricultural sector. Methane digesters, for example, can
capture methane from manure and convert it into biogas, which can then be used
for energy.
- Shifting to Renewable Energy: Reducing reliance on fossil fuels
and transitioning to renewable energy sources like wind, solar,
and hydroelectric power will help decrease methane emissions, particularly those
from the natural gas industry.
Conclusion:
Methane (CH₄) is a potent greenhouse gas that plays a significant role in global
warming, particularly in the short term. While methane emissions come from both
natural and human sources, the latter (especially fossil fuel extraction,
agriculture, and waste management) present the largest opportunities for
mitigation. Reducing methane emissions is a key strategy for addressing climate
change and limiting global warming, with significant benefits for both
short-term and long-term climate goals. Efforts to reduce methane emissions are
becoming a priority in international climate policy and industry practices.
(source: ChatGPT)
|
|
|
- The radiative forcing of N2O(in W/m-2). Nitrous oxide (N2O), commonly known as laughing gas, is a potent greenhouse gas and an ozone-depleting substance. It occurs naturally in the environment but is also significantly produced by human activities, particularly in agriculture and industrial processes. N2O is an important compound in the context of both climate change and stratospheric ozone depletion.(source: ChatGPT)
- User can enter values; if no values entered then values based on 'aggressiveness' of mitigation selection
| This graph compares the projected value (heavy black line) to the range of values from some of the SSPs. | | This graph compares the projected value (heavy black line) to the range of possible mitigation 'aggressivenesses'. | |
|---|
|
| |
| |
|
|
Additional Information |
Key Characteristics of Nitrous Oxide (N₂O):
- Chemical Formula: N₂O consists of two nitrogen atoms (N) and
one oxygen atom (O).
- Physical Properties: It is colorless, non-flammable, and has a
slightly sweet odor. N₂O is commonly used in medicine as an anesthetic and pain
reliever, and as a propellant in aerosol products.
- Sources: N₂O is emitted both from natural and anthropogenic
(human-caused) sources.
Natural Sources of N₂O:
- Soils: The largest natural source of N₂O is the
microbial processes that occur in soils, particularly in
wetlands, where microbes break down nitrogen compounds under anaerobic
(low oxygen) conditions. These microbes produce N₂O as a byproduct.
- Oceans: Oceans also contribute a smaller amount of N₂O,
primarily due to microbial processes in coastal and marine ecosystems.
- Forests and Grasslands: Natural nitrogen cycles in forests and
grasslands can produce small amounts of N₂O, mainly through soil microbes.
Anthropogenic Sources of N₂O:
Human activities are responsible for the vast majority of the N₂O emissions in
the atmosphere. The main sources include:
-
Agriculture:
- Fertilizer Use: The most significant anthropogenic source of
N₂O comes from the use of synthetic nitrogen fertilizers. When fertilizers are
applied to soil, microbes in the soil convert the nitrogen in the fertilizers
into various forms, including N₂O, through processes like nitrification
and denitrification.
- Manure Management: Livestock farming also contributes to N₂O
emissions. The decomposition of animal manure, particularly in wet conditions,
results in the production of N₂O.
-
Fossil Fuel Combustion: The burning of fossil fuels, especially
in cars and industrial processes, releases small amounts of N₂O into the
atmosphere. N₂O is produced during the combustion of fuel containing nitrogen
impurities.
-
Industrial Processes: Some industrial activities, such as the
production of nylon and nitric acid, release N₂O as a byproduct.
-
Waste Treatment: Wastewater treatment plants, particularly
those dealing with nitrogen-rich waste, can produce N₂O emissions during the
microbial treatment of the waste.
Environmental Impact of N₂O:
-
Global Warming Potential (GWP):
- N₂O is a potent greenhouse gas, with a GWP
around 298 times that of CO₂ over a 100-year period. This means
that, molecule for molecule, N₂O has a significantly higher heat-trapping
potential than CO₂.
- Although N₂O is present in the atmosphere in much smaller quantities than CO₂,
its high GWP makes it a major concern for climate change.
-
Ozone Depletion:
- N₂O is also an ozone-depleting substance. When it reaches the
stratosphere, N₂O is broken down by ultraviolet (UV) radiation, releasing
nitrogen oxides (NOₓ), which then contribute to the destruction of ozone
molecules in the stratosphere. The ozone layer protects life on Earth by
blocking harmful UV radiation.
- N₂O is considered the most significant ozone-depleting substance that is
not controlled by the Montreal Protocol, a treaty designed to phase out
ozone-depleting chemicals like CFCs.
Mitigation of N₂O Emissions:
Reducing N₂O emissions is important for both mitigating climate change and
protecting the ozone layer. Some strategies to reduce N₂O emissions include:
-
Agricultural Practices:
- Efficient Fertilizer Use: Reducing excess nitrogen fertilizer
use is one of the most effective ways to cut N₂O emissions. This can be achieved
through better fertilizer management practices, including precision farming,
which applies the right amount of fertilizer at the right time.
- Improved Manure Management: Techniques such as anaerobic
digestion, where manure is processed to produce biogas, can reduce N₂O emissions
from livestock farming.
- Cover Cropping: Planting cover crops during off-seasons can
help to absorb nitrogen in the soil, reducing the potential for N₂O emissions
when fertilizers are applied.
- Nitrification Inhibitors: Certain chemicals known as
nitrification inhibitors can be added to soils to slow down the conversion of
nitrogen to N₂O, thereby reducing emissions.
-
Reducing Industrial Emissions:
- Cleaner Industrial Technologies: Modifying industrial processes
to reduce the production of N₂O, such as in the production of nitric acid and
nylon, can help cut emissions from these sectors.
- Waste Treatment Improvements: Optimizing wastewater treatment
technologies to minimize N₂O production can reduce emissions from this source.
-
Policy and Regulation:
- Governments can implement regulations and policies that promote
sustainable agricultural practices, encourage energy efficiency,
and require emission reductions from industrial sectors. These
measures can help limit the amount of N₂O released into the atmosphere.
-
Alternative Nitrogen Fertilizers:
- Developing and using fertilizers with lower nitrogen content or
that are more efficient in the soil can help decrease N₂O
emissions. Some alternatives, such as controlled-release fertilizers,
release nutrients more gradually, reducing the potential for N₂O formation.
Conclusion:
Nitrous oxide (N₂O) is a powerful greenhouse gas and an important contributor to
both global warming and ozone depletion. While
natural sources of N₂O exist, human activities, particularly agriculture, are
the primary drivers of its emissions. Addressing N₂O emissions is crucial for
mitigating climate change and protecting the ozone layer. Strategies to reduce
emissions include better agricultural practices, improved waste management, and
cleaner industrial technologies. By targeting N₂O emissions, significant progress can be made in the efforts to address climate change and environmental
protection.
(source: ChatGPT)
|
|
|
- The radiative forcing from all of the greenhouse gases except CO2, CH2, and N2O (in W/m-2)
- User can enter values; if no values entered then values based on 'aggressiveness' of mitigation selection
| This graph compares the projected value (heavy black line) to the range of values from some of the SSPs. | | This graph compares the projected value (heavy black line) to the range of possible mitigation 'aggressivenesses'. | |
|---|
|
| |
| |
|
|
- The radiative forcing from aerosols (in W/m-2). Aerosols are tiny solid or liquid particles suspended in the atmosphere. They can originate from both natural sources and human activities. Aerosols play a crucial role in the Earth's climate system and can have significant effects on air quality, weather patterns, and the global climate.(source: ChatGPT)
- User can enter values; if no values entered then values based on 'aggressiveness' of mitigation selection
| This graph compares the projected value (heavy black line) to the range of values from some of the SSPs. | | This graph compares the projected value (heavy black line) to the range of possible mitigation 'aggressivenesses'. | |
|---|
|
| |
| |
|
|
Additional Information |
Types of Aerosols:
-
Natural Aerosols:
- Sea Spray: Tiny droplets of seawater that are released into the
air when waves break on the ocean's surface. These aerosols can contribute to
cloud formation and influence the Earth's radiation balance.
- Dust: Fine particles of soil and sand, often from deserts, that
are lifted into the atmosphere by wind. Dust aerosols can affect air quality,
cloud formation, and regional climate.
- Volcanic Ash: Particles released during volcanic eruptions.
Volcanic aerosols, such as sulfur dioxide (SO₂), can remain in the atmosphere
for months or even years, affecting global temperatures and air quality.
- Biological Aerosols: Particles released by plants, fungi, and
bacteria, including pollen, spores, and microorganisms. These can affect air
quality and human health, and in some cases, influence cloud formation.
-
Anthropogenic (Human-made) Aerosols:
- Industrial Emissions: Aerosols produced by burning fossil fuels
in power plants, factories, and vehicles. These aerosols often contain
pollutants such as sulfur dioxide (SO₂), nitrogen
oxides (NOx), and black carbon (soot).
- Aerosols from Biomass Burning: Wood, crop waste, and other
organic materials are burned for heating, cooking, or land clearing. These fires
release particulate matter, including carbon-based aerosols, into the
atmosphere.
- Aerosols from Agriculture: Dust and chemicals used in
agricultural practices, such as pesticides or fertilizers, can also form
aerosols that enter the atmosphere.
- Aerosols from Urbanization: The expansion of cities can release
large amounts of aerosols from construction, transportation, and industrial
processes.
Effects of Aerosols on the Climate:
Aerosols can influence the climate in several ways, both directly
(by affecting the Earth's radiation balance) and indirectly (by
modifying cloud properties).
-
Direct Effect:
- Aerosols reflect, absorb, or scatter sunlight, which can alter the amount of
solar energy reaching the Earth's surface. For example:
- Reflecting Aerosols (such as sulfates and sea spray) can
cool the Earth's surface by reflecting sunlight back into
space. This can reduce global temperatures.
- Absorbing Aerosols (such as black carbon) can warm the
atmosphere by absorbing sunlight and radiating heat.
- The net effect of aerosols on climate depends on their composition, size, and
altitude.
-
Indirect Effect:
- Aerosols can influence cloud formation and cloud
properties. For example:
- Cloud Condensation Nuclei (CCN): Aerosols act as nuclei around
which water droplets form to create clouds. An increase in aerosols can lead to
clouds with more droplets but smaller sizes, making the clouds
more reflective and potentially cooling the Earth's surface.
- Cloud Lifetime: Aerosols can also affect the lifetime
and extent of clouds. More aerosols may lead to more persistent
clouds that could affect regional weather patterns and rainfall.
- These aerosol-induced changes in cloud properties can affect regional and global
weather, rainfall patterns, and atmospheric circulation.
Impact on Weather and Air Quality:
- Air Pollution: Aerosols can be harmful to human health. Small
particles, particularly PM2.5 (particles smaller than 2.5
micrometers), can penetrate deep into the lungs and cause respiratory and
cardiovascular diseases.
- Visibility: Aerosols in the atmosphere, especially from
industrial pollution or wildfires, can reduce visibility and
create hazy conditions. This can affect both urban and rural areas.
- Acid Rain: Some aerosols, particularly those containing sulfur
compounds, can combine with water vapor to form acid rain,
which harms ecosystems, crops, and buildings.
Aerosols and Climate Feedbacks:
Aerosols can be involved in climate feedback mechanisms. For
example:
- Amplification of Warming: As aerosols cause the melting of ice
or snow by lowering the Earth's albedo (reflectivity), the loss of ice
cover can expose darker surfaces beneath (such as ocean or land), which
absorb more heat and further accelerate warming.
- Reduced Effectiveness of Some Climate Mitigation: Aerosols like
sulfates can temporarily mask some effects of global warming, but they do not
solve the underlying problem of greenhouse gas emissions. Reducing
aerosol emissions (such as through cleaner technologies) might result
in short-term warming, even if greenhouse gases are being reduced.
Sources of Aerosols:
- Natural Sources:
- Volcanic eruptions
- Wildfires
- Dust storms
- Ocean spray (sea salt)
- Plant material and biogenic aerosols (like pollen)
- Anthropogenic (Human-caused) Sources:
- Combustion of fossil fuels (e.g., from vehicles and power plants)
- Industrial processes (e.g., cement and metal production)
- Agriculture (e.g., burning of biomass and pesticide use)
- Residential heating and cooking
Aerosols and Global Warming:
Aerosols can influence global warming by either cooling or
warming the Earth’s climate:
- Cooling Effect: Aerosols that reflect sunlight (like sulfate
aerosols) can offset some of the warming caused by greenhouse gases, but this
effect is limited and temporary.
- Warming Effect: Aerosols that absorb sunlight (like black
carbon) can warm the atmosphere and contribute to regional climate changes,
especially in sensitive areas like the Arctic.
Challenges in Climate Modeling:
The effects of aerosols on climate are complex and not yet fully understood. The
following factors make it difficult to quantify the exact impact of aerosols:
- Aerosols are highly variable in space and time.
- The way aerosols interact with clouds and sunlight is still being researched.
- Aerosols have both direct and indirect
effects, which complicates predictions.
Conclusion:
Aerosols play a significant role in both climate and air quality.
They can have both cooling and warming effects
on the Earth's climate, primarily through their interaction with sunlight and
clouds. While natural sources contribute significantly to aerosol levels, human
activities, particularly industrial emissions and fossil fuel burning, are key
contributors to aerosol pollution. Their impact on climate change is an area of
ongoing research, as understanding the complexities of aerosols is crucial for
improving climate models and addressing air quality issues.
(source: ChatGPT)
|
|
|
- The radiative forcing from changes in the Earth's albedo (in W/m-2).
Albedo is a term used to describe the reflectivity
of a surface or body, specifically how much sunlight (solar radiation) is
reflected by that surface compared to how much is absorbed. It is expressed as a
percentage or a value between 0 and 1, where:
- Albedo of 0 means no reflection (complete absorption of
sunlight).
- Albedo of 1 means perfect reflection (no absorption of
sunlight).
In other words, a surface with high albedo reflects most of the sunlight that
hits it, while a surface with low albedo absorbs most of the sunlight. Albedo is
an important concept in climate science because it directly influences the
Earth's energy balance and temperature. (source: ChatCPG)
- User can enter values
|
|
Additional Information |
Factors Affecting Albedo:
-
Surface Type:
- Snow and Ice: Snow and ice have high albedo (typically around
0.8 to 0.9), meaning they reflect most of the sunlight. This is why regions with
ice and snow (like the polar regions) help to cool the Earth by reflecting solar
radiation.
- Water: Water has a lower albedo, especially when the sun is
directly overhead (around 0.06 for the ocean). Water absorbs much of the
sunlight that hits it, which helps warm the Earth's surface.
- Forests and Vegetation: Forested areas and vegetation have
moderate albedo, typically between 0.1 and 0.2, depending on the type of plants
and the density of the cover.
- Deserts and Sand: Sandy areas or deserts typically have higher
albedo (around 0.3 to 0.4) because the light-colored sand reflects a significant
portion of sunlight.
- Urban Areas: Cities often have a lower albedo due to asphalt,
buildings, and other materials that absorb more sunlight and heat up faster than
natural surfaces.
-
Surface Condition:
- Fresh Snow has a higher albedo compared to older, dirty snow.
As snow ages and accumulates dirt, soot, or black carbon, its albedo decreases,
leading it to absorb more heat.
- Clouds: Clouds reflect a large amount of sunlight, especially
thick clouds. The albedo of clouds can vary depending on their type, thickness,
and altitude.
-
Angle of the Sun:
- The angle at which sunlight hits a surface also affects its
albedo. When the sun is directly overhead (like at the equator), the albedo is
often lower because sunlight is more concentrated. When the sun is at a lower
angle (like at higher latitudes), the albedo is higher because sunlight is
spread over a larger area.
Albedo and Climate Change:
Albedo plays a critical role in climate regulation and can
influence the Earth's temperature in the following ways:
-
Positive Feedback Loop:
- In regions where snow and ice are abundant (such as the Arctic), the high albedo
helps reflect sunlight and cool the region. However, as temperatures rise due to
global warming, ice and snow melt, revealing darker surfaces (such as ocean
water or land) that have a lower albedo.
- This leads to more absorption of sunlight and faster
warming, creating a positive feedback loop. The more
ice and snow that melt, the more heat is absorbed by the Earth's surface, which
accelerates warming and leads to even more ice loss.
-
Global Warming:
- Reduction of Ice Cover: As the Earth's temperature increases,
particularly in the Arctic, the loss of ice decreases the
planet's overall albedo, leading to a feedback loop that accelerates warming.
This is a major factor in Arctic amplification, where the
Arctic warms at a much faster rate than other parts of the world.
- Deforestation and Land Use Changes: Changes in land use, such
as deforestation, can reduce albedo by replacing reflective forests with darker
surfaces (like urban areas or agricultural land), leading to local temperature
increases.
-
Geoengineering:
- Some geoengineering proposals aim to modify albedo to mitigate
climate change, such as by spraying reflective aerosols into the stratosphere
(to mimic the cooling effect of volcanic eruptions) or by enhancing the
albedo of surfaces like rooftops or deserts to reflect more sunlight.
Albedo and Earth’s Energy Balance:
Albedo is directly related to the Earth's energy balance. If
the Earth absorbs more energy than it reflects, it warms up. Conversely, if the
Earth reflects more energy than it absorbs, it cools down. Changes in
albedo—whether due to changes in ice cover, vegetation, or human activities—can
significantly affect this balance and thus influence global and regional
climates.
Summary:
Albedo is a measure of how much sunlight is reflected by a surface. Surfaces
like snow and ice have high albedo and help cool the planet, while surfaces like
oceans and forests have lower albedo and absorb more heat. Albedo has a profound
effect on global climate and contributes to feedback
mechanisms that can accelerate climate change. Reducing albedo in polar
regions by melting ice or increasing albedo in urban environments can
significantly influence local and global temperatures.
(source: ChatGPT)
|
|
|
- The total radiative forcing (in W/m-2)
- Calculated: Sum of all the above RFs
|
|
- The temperature increase based on the total radiative forcing from greenhouse gases, aerosols, albedo, etc.
- Calculated: based on year, PPM, and total RF (details to be added later)
|
|
- The amount of 'solar radiation management' either required as specified directly by the user or calculated from the temperature increase goal
- User can enter values
|
|
- The temperature increase after the 'solar radiation management' is taken into account
- Calculated: Either 'Temp Incr Goal' or Temp Incr (based on RF) - temp change from SRM using the formula "Value for SRM (in W/m-2) * Climate Sensivity * 0.26964486;
|
|
- Average annual cost carbon dioxide removal all CDR
- Calculated: Total Carbon Removal * Carbon Removal cost/ton
|
|
- Annual costs of sea level rise
- The user can enter values. The model initializes the cost of disasters to $300 Billion in 2100 for the most aggressive mitigation scenario and to $750 Billion in 2100 for the least aggressive scenario. This needs to be adjusted.
|
|
- Annual cost carbon dioxide removal for DAC
|
|
- Annual costs of disasters
- The user can enter values. The model initializes the cost of disasters to $300 Billion in 2100 for the most aggressive mitigation scenario and to $750 Billion in 2100 for the least aggressive scenario. This needs to be adjusted.
|
|
Additional Information |
Cost of Disasters
|
The annual costs for climatological, hydrological, and meteorological natural disasters for 2000 through 2023 were obtained from
The Centre for Research on the Epidemiology of Disasters (CRED)
(https://public.emdat.be/data) (see Figure 1). Linear projections of this data though 2100 were then made (see Table 1). |
|
|
|
Year |
Projected Cost |
|
2025 |
216 |
|
2030 |
243 |
|
2035 |
269 |
|
2040 |
295 |
|
2045 |
321 |
|
2050 |
348 |
|
2055 |
374 |
|
2060 |
400 |
|
2065 |
427 |
|
2070 |
453 |
|
2075 |
479 |
|
2080 |
506 |
|
2085 |
532 |
|
2090 |
558 |
|
2095 |
585 |
|
2100 |
611 |
|
|
|
Figure 1. Scatter plot of annual natural disaster costs. |
Table 1. Linear projections of this data though 2100 |
Figure 2. Total costs of all natural disasters |
|
|
|
|
|
|
- Annual total costs of disasters, CDR, etc.
- User can enter values
|
|
- The total radiative forcing (in W/m-2)
- Calculated: Sum of all the above RFs
|
|
- The temperature increase for the original scenario (only displated if one was specified)
- The temperature increase for the original scearion (only displated if one was specified)
| This graph compares the projected value (heavy black line) to the range of values from some of the SSPs. | |
|---|
|
| |
|
|
- The total radiative forcing (in W/m-2)
- Calculated: Sum of all the above RFs
|
|
- The temperature increase after changes to both CO2 and Non-CO2 emissions are taken into account
- Calculated: Either 'Temp Incr Goal' or Temp Incr (based on RF) - temp change from SRM using the formula "Value for SRM (in W/m-2) * Climate Sensivity * 0.26964486;
|
|
- The temperature increase after changes to both CO2 and Non-CO2 emissions are taken into account
- Calculated: Either 'Temp Incr Goal' or Temp Incr (based on RF) - temp change from SRM using the formula "Value for SRM (in W/m-2) * Climate Sensivity * 0.26964486;
|
|
- The temperature increase based on the total radiative forcing from greenhouse gases, aerosols, albedo, etc.
- Calculated: based on year, PPM, and total RF (details to be added later)
|
|
- The total radiative forcing (in W/m-2)
- Calculated: Sum of all the above RFs
|
|
- The temperature increase based on the total radiative forcing from greenhouse gases, aerosols, albedo, etc.
- Calculated: based on year, PPM, and total RF (details to be added later)
|
|
- An estimate of the size of the temperature spikes in 2023 and 2024 that was not due to natural variation and is not included in climate models - i.e., the permanent temperature increase that needs to be added to the temperature projections of climate models
- User can enter value
|
|
- An estimate of the size of the temperature spikes in 2023 and 2024 that was not due to natural variation and is not included in climate models - i.e., the permanent temperature increase that needs to be added to the temperature projections of climate models
- User can enter value
|
|
- The temperature increase after the 'temperature spike' is taken into account
- Temperture increase adjusted for the temperature spike
|
|
- The amount of 'solar radiation management' either required as specified directly by the user or calculated from the temperature increase goal
- User can enter values
|
|
- The total radiative forcing (in W/m-2)
- Calculated: Sum of all the above RFs
|
|
- The temperature increase after the 'solar radiation management' is taken into account
- Calculated: Either 'Temp Incr Goal' or Temp Incr (based on RF) - temp change from SRM using the formula "Value for SRM (in W/m-2) * Climate Sensivity * 0.26964486;
|
|
- An estimate of the size of the temperature spikes in 2023 and 2024 that was not due to natural variation and is not included in climate models - i.e., the permanent temperature increase that needs to be added to the temperature projections of climate models
- User can enter value
|
|
- The temperature increase after the 'temperature spike' is taken into account
- Temperture increase adjusted for the temperature spike
|
|
- The temperature increase goal (user input)
- User can enter values
|
|
|
|
|
|
|
|
|
|
|
Select a "CO2 Emissions Only" pathway with the indicated temparature increase:
1.5℃
2.0℃
2.5℃
3.0℃
3.5℃
4.0℃
|
| Carbon Dioxide Removal (CDR) |
|---|
|
| |
| |
| |
| |
| |
|
|
|
|
|
|
|
|
| Net Anthro. CO2 Emssions (GTCO2) | | |
| | | | | | | |
| Total Anthro. CO2 (GtCO2) | | |
| | | | | | | |
| | | | | Total Other CO2e (GtCO2e) | | |
| | | |
| | | Sea Level Rise Costs ($B/Yr) | | |
| | | | | |
| Carbon Removal Cost Per Ton ($/Ton) | | |
| | | Carbon Removal Cost ($B/Yr) | | |
| | | Carbon Removal (Temp Goal) (GtCO2) | | |
| | | |
|
| Valdation of PPM and Temparture Calculations |
|---|
|
Scenario |
CO2 PPM from Cum CO2 Emissions |
Temp Incr From CO2 PPM |
|
Cum CO2
|
CO2 PPM |
En-ROADS PPM |
Temp Increase |
AR6 Temp Increase |
|
Basic |
xxx |
xxx |
xxx |
xxx |
xxx |
|
Basic + CCS |
xxx |
xxx |
xxx |
xxx |
xxx |
|
Basic + Acc |
xxx |
xxx |
xxx |
xxx |
xxx |
|
Basic + CCS + ACC |
xxx |
xxx |
xxx |
xxx |
xxx |
|
About
The Scenario Explorer is being developed by Bruce Parker. Please email any bugs, suggestions, etc. to him at bruce@chesdata.com.
- Click here for a description as to how the model works
- Click here to download the PowerPoint slides for a
presentation on March 20, 2025 to the Healthy Planet Action Coalition. The slides include both a description as to how the model works and screenshots from
this Web page. The PPTX file also contains the speaker's "text" for each slide,
|
QQOverviewQQ
QQReviewQQ
QQInputQQ
QQDeep DiveQQ
|